Monitor a Site
This section shows you how to view and monitor your Nebula Devices and WiFi/wired networks within a site.
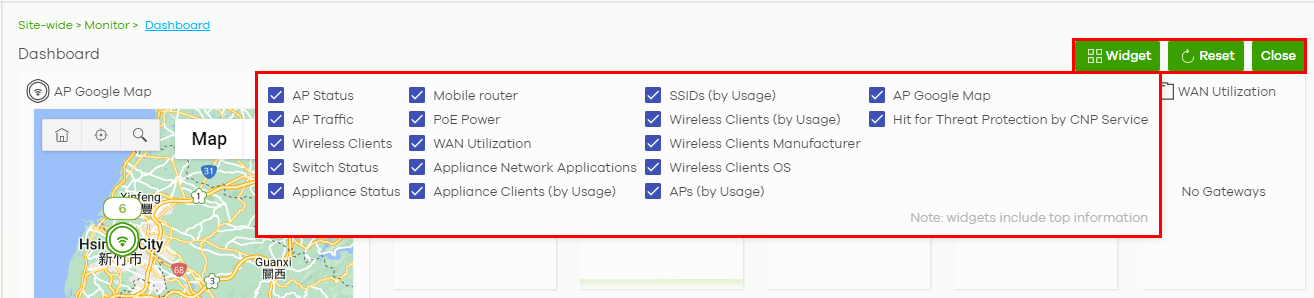
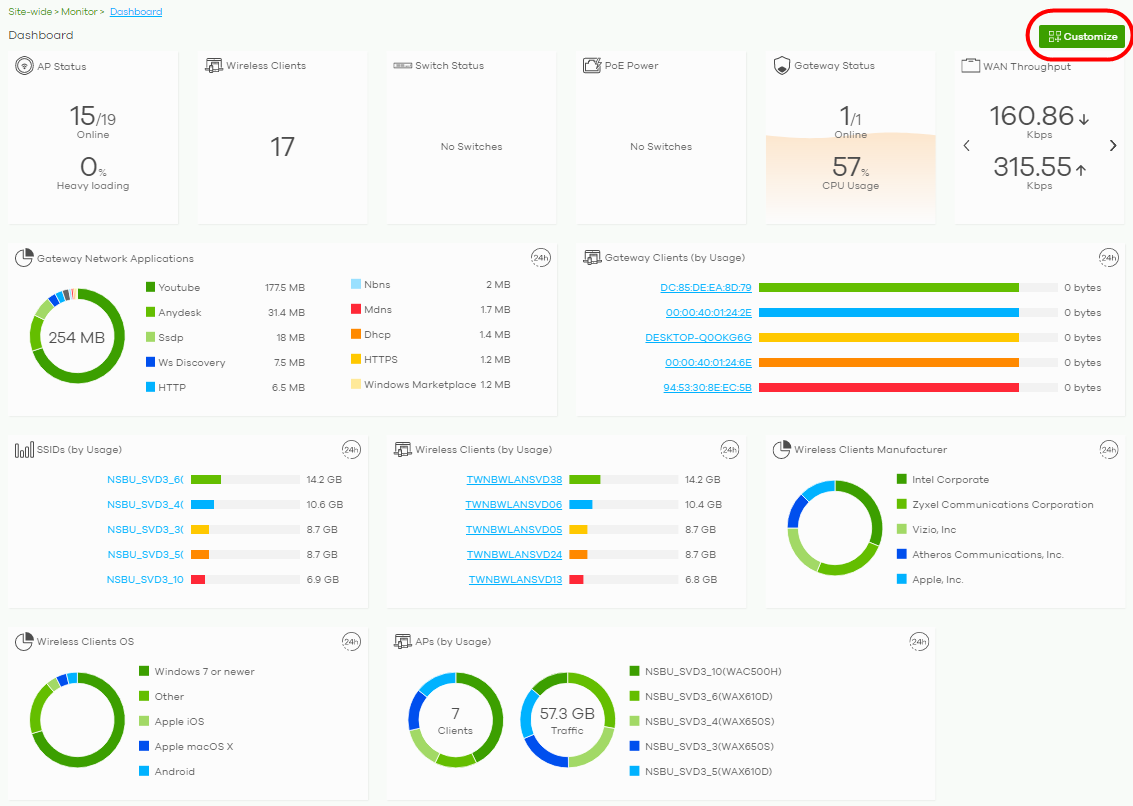
1 Go to the Site-wide > Monitor > Dashboard screen. To change the default view, click Customize to show the Widget, Reset, and Close buttons.
2 Click Widget to select which widgets to display. For example, clicking SSIDs (by Usage) will show the top 5 SSIDs with the highest percentage of bandwidth usage in the past 24 hours.
Click Reset to restore the dashboard back to the default view.
Click Close to hide the Widget. Reset, and Close buttons and show the Customize button.
Click Reset to restore the dashboard back to the default view.
Click Close to hide the Widget. Reset, and Close buttons and show the Customize button.