Switch
Overview
This chapter discusses the menus that you can use to monitor the Nebula managed Switches in your network and configure settings even before a Nebula Device is deployed and added to the site.
Nebula Device refers to Zyxel Hybrid Switches (GS / XGS / XMG / XS Series) in this chapter. To view the list of Nebula Devices that can be managed through NCC, go to Help > Support tools > Device function table.
Monitor
Use the Monitor menus to check the Nebula Device information, client information, event log messages and summary report for Nebula Devices in the selected site.
Switches
This screen allows you to view the detailed information about a Nebula Device in the selected site. Click Switch > Monitor > Switches to access this screen.
Switch > Monitor > Switches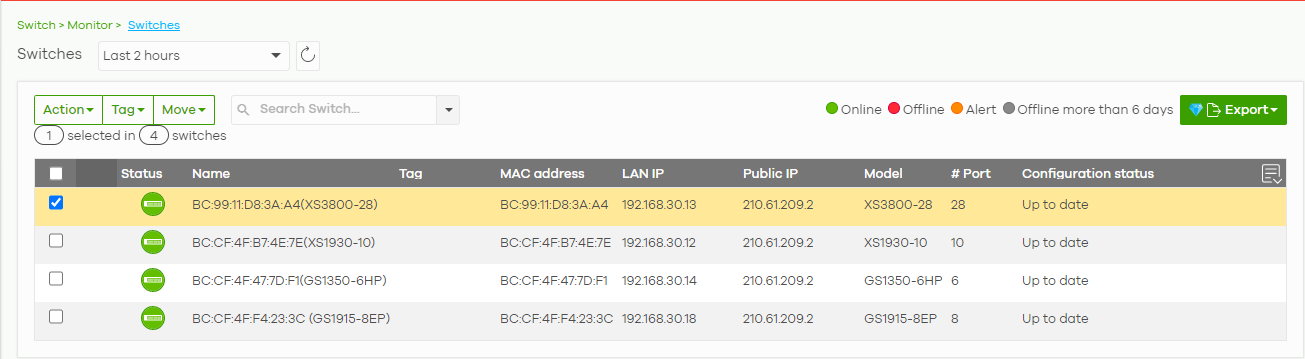
The following table describes the labels in this screen.
Label | Description |
|---|---|
Switch | Select to view the Nebula Device information and connection status in the past two hours, day, week or month. |
Click this button to reload the data-related frames on this page. | |
Action | Perform an action on the selected Nebula Devices. |
Reboot | Restart the Nebula Device. |
Upgrade | Upgrade the firmware on the Nebula Device. |
Tag | Select one or multiple Nebula Devices and click this button to create a new tag for the Nebula Devices or delete an existing tag. |
Move | Select one or multiple Nebula Devices and click this button to move the Nebula Device to another site or remove the Nebula Device from the current site. |
Search | Specify your desired filter criteria to filter the list of Nebula Devices. |
Switch | This shows the number of Nebula Devices connected to the site network. |
Export | Click this button to save the Nebula Device list as a CSV or XML file to your computer. |
Status | This shows the status of the Nebula Device. Hover the mouse over the icon for a brief description. • Green: The Nebula Device is online and has no alerts. • Amber: The Nebula Device has alerts. • Red: The Nebula Device is offline. • Gray: The Nebula Device has been offline for 7 days or more. • With lock: The Nebula Device is locked by Auto Configuration Recovery. See Switch > Configure > Switch settings for more information. Move the cursor over an amber alert icon to view the alerts the NCC generates when an error or something abnormal is detected on the IPTV network. |
Name | This shows the descriptive name of the Nebula Device. |
Tag | This shows the user-specified tag for the Nebula Device. |
MAC address | This shows the MAC address of the Nebula Device. |
LAN IP | This shows the local (LAN) IP address of the Nebula Device. |
Public IP | This shows the global (WAN) IP address of the Nebula Device. |
Model | This shows the model number of the Nebula Device. |
# Port | This shows the number of the Nebula Device port which is connected to the NCC. |
Configuration status | This shows whether the configuration on the Nebula Device is up-to-date. |
Bandwidth Utilization (Uplink port) | This shows what percentage of the upstream/downstream bandwidth is currently being used by the Nebula Device’s uplink port. |
Production information | This shows the Nebula Device’s product description to explain what this Nebula Device is and also provides information about its features. |
Connectivity | This shows the Nebula Device connection status. Nothing displays if the Nebula Device is offline. The gray time slot indicates the connection to the NCC is down, and the green time slot indicates the connection is up. Move the cursor over a time slot to see the actual date and time when a Nebula Device is connected or disconnected. |
Description | This shows the user-specified description for the Nebula Device. |
Serial number | This shows the serial number of the Nebula Device. |
Firmware status | This shows whether the firmware installed on the Nebula Device is up-to-date. |
Current version | This shows the firmware version currently installed on the Nebula Device. |
Usage | This shows the amount of data that has been transmitted or received by the Nebula Device’s clients. |
Click this icon to display a greater or lesser number of configuration fields. For faster loading of data, select only the configuration fields listed that do NOT take a long time to fetch data. |
Switch Details
Click a Nebula Device entry in the Switch > Monitor > Switches screen to display individual Nebula Device statistics.
Switch > Monitor > Switches: Switch Details
The following table describes the labels in this screen.
Label | Description |
|---|---|
Click this button to reload the data-related frames on this page. | |
Unlock | This button only appears when the Nebula Device is locked by NCC. Click this button to continue using the Nebula Device. |
Configuration Click the edit icon to change the Nebula Device name, description, tags and address. You can also move the Nebula Device to another site. After modifying a Nebula Device name, the new name will be synchronized to the Nebula Device and can be seen by protocols such as SNMP and LLDP. | |
Name | This shows the descriptive name of the Nebula Device. |
MAC address | This shows the MAC address of the Nebula Device. |
Serial number | This shows the serial number of the Nebula Device. |
Description | This shows the user-specified description for the Nebula Device. |
Address | This shows the user-specified address for the Nebula Device. |
Tag | This shows the user-specified tag for the Nebula Device. |
Status | |
LAN IP | This shows the local (LAN) IP address of the Nebula Device. It also shows the IP addresses of the gateway and DNS servers. Click the edit icon to open a screen where you can change the IP address, VLAN ID number and DNS server settings. |
DHCP Server | This shows the IP address of the DHCP server. |
Public IP | This shows the global (WAN) IP address of the Nebula Device. |
Topology | |
RSTP Status | This shows Disabled when RSTP is disabled on the Nebula Device. Otherwise, it shows the name or MAC address of the Nebula Device that is the root bridge of the spanning tree, and the bridge priority. |
IGMP Status | This shows whether IGMP is enabled on the Nebula Device. If IGMP is enabled, it also shows the ID number of the VLAN on which the Nebula Device learns the multicast group membership and the IP address of the Nebula Device interface in IGMP querier mode. |
PoE Status | This shows the power management mode, the amount of power the Nebula Device is currently supplying to the connected PoE-enabled devices and the total power the Nebula Device can provide to the connected PoE-enabled devices on the PoE ports. N/A displays if the Nebula Device does not support PoE. Click the edit icon to open the PoE Configuration screen. See PoE Configuration. |
History | Click Event log to go to the Switch > Monitor > Event log screen. |
Configuration status | This shows whether the configuration on the Nebula Device is up-to-date. |
Firmware | This shows whether the firmware on the Nebula Device is up-to-date or there is firmware update available for the Nebula Device. |
Current version | This shows the firmware version currently installed on the Nebula Device. |
Map | This shows the location of the Nebula Device on the Google map. |
Photo | This shows the photo of the Nebula Device. Click Add to upload one or more photos. Click x to remove a photo. |
Ports This shows the ports on the Nebula Device. You can click a port to see the individual port statistics. See Switch Port Details. Move the pointer over a port to see additional port information. The port color indicates the connection status of the port. • Gray (#888888): The port is disconnected. • Orange (#FF8900): The port is connected and is transmitting data at 10 or 100 Mbps. • Green (#64BE00): The port is connected and is transmitting data at 1000 Mbps (1 Gbps). • Azure (#0079FF): The port is connected and is transmitting data at 2.5 Gbps. • Violet (#8800FF): The port is connected and is transmitting data at 5 Gbps. • Blue (#004FEE): The port is connected and is transmitting data at 10000 Mbps (10 Gbps). When the port is in the STP blocking state, a blocked icon displays on top of the port ( | |
Name | This shows the Nebula Device name configured in NCC. |
Status | This shows the connection status of the port. |
Type | This shows the port type (Trunk or Access), PVID, and allowed VLANs. |
Speed | This shows the current connection speed of the port. If the speed is unavailable, this displays “Ethernet”. |
LLDP | This shows the LLDP information received on the port. |
Reset | This button only appears when the PoE port is connected to a PD (powered device). Follow the prompt and click Confirm to reboot the PD connected to this port. |
Configure ports | Click this button to go to the Switch > Configure > Switch ports screen, where you can view port summary. See Switch Ports. |
Live tools | |
Ping | Enter the host name or IP address of a computer that you want to perform ping in order to test a connection and click Ping. |
Port Power Cycle | Enter the number of the ports and click the Reset button to disable and enable the ports again. |
MAC table | This shows what device MAC address, belonging to what VLAN group (if any) is forwarded to which ports. You can define how it displays and arrange the data in the summary table below. |
Switch tables | Import the following data into NCC: • MAC table. Click Run to show what device MAC address, belonging to what VLAN group (if any) is forwarded to which ports. You can define how it displays and arrange the data in the summary table. • Routing table. Click Run to show the routing destination, gateway, interface IP addresses, hop count, and routing methods. The routing table is only displayed for L3 Nebula Devices. • ARP table. Click Run to show the IP-to-MAC address mappings. The ARP table is only displayed for L3 Nebula Devices. • IP source guard. Click Run to show the static, DHCP snooping, blocked client entries, and expiration time of DHCP snooping and blocked entries on the Nebula Device. After clicking Run in IP source guard, the IPSG (IP source guard) table could be empty if: • It takes about 5 minutes to refresh the address table after you apply the Nebula Device settings • Protected port is not specified • NCC may not get completed data from Nebula Device due to unstable network. Please retry. |
Reboot switch | Click the Reboot button to restart the Nebula Device. |
Locator LED | Enter a time interval between 1 and 60 minutes to stop the locator LED from blinking. The locator LED will start to blink for the number of minutes set here. Click the  button to turn on the locator feature, which shows the actual location of the Nebula Device between several Nebula Devices in the network. button to turn on the locator feature, which shows the actual location of the Nebula Device between several Nebula Devices in the network. |
Remote Access | Select to use TCP (Transmission Control Protocol) Port 22 or 443 to establish a remote connection to this Nebula Device. The Nebula Device will create a reverse SSH (Secure SHell) connection. Then click Establish. After clicking Ok, NCC will provide a remote connection IPv4 address and service port number. For example, Remote connection: 34.247.173.104:27086. Use this IPv4 address and port to connect to the Nebula Device using an SSH terminal emulator (for example, Putty). The remote session will be available for 30 minutes. In case the connection cannot be established, confirm that the network allows Port 22 or 443. |
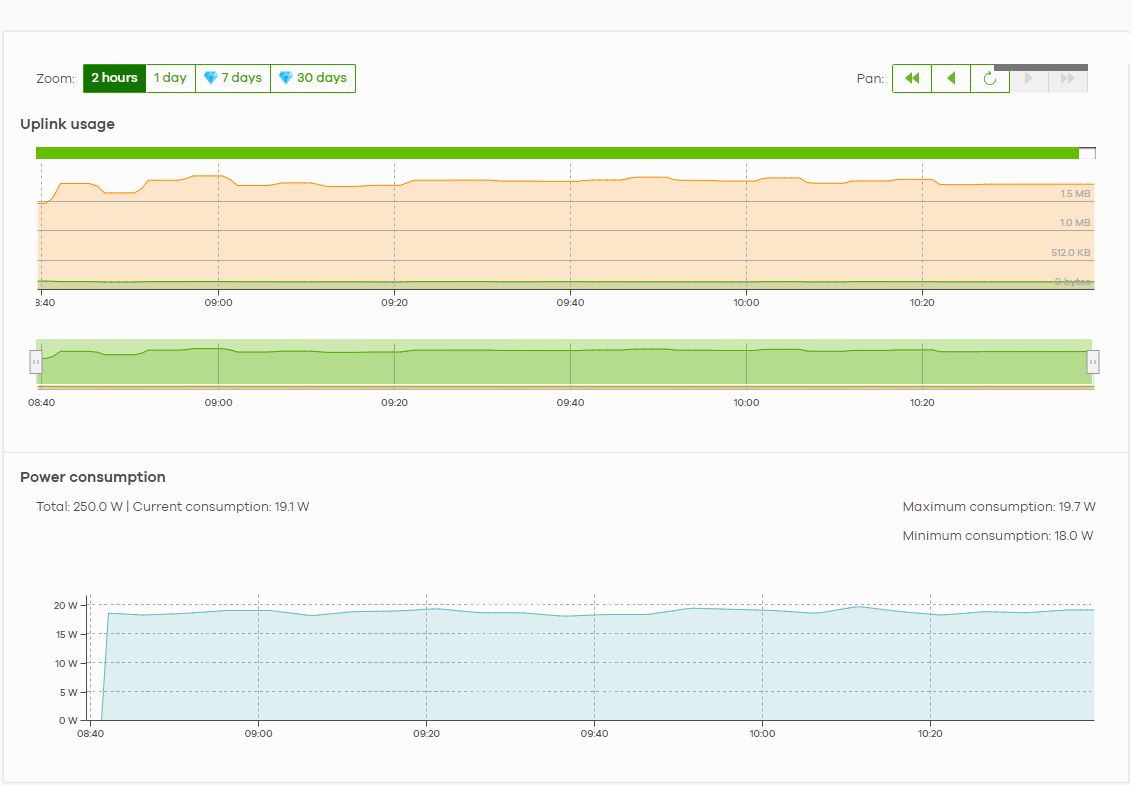
Uplink usage Move the cursor over the chart to see the transmission rate at a specific time. | |
Zoom | Select to view the statistics in the past 12 hours, day, week, month, 3 months or 6 months. |
Pan | Click to move backward or forward by one day or week. |
Power Consumption | |
Select to view the Nebula Device power consumption in the past two hours, day, week or month. | |
This shows the current, total, maximum and minimum power consumption of the Nebula Device. | |
y-axis | The y-axis shows how much power is used in Watts. |
x-axis | The x-axis shows the time period over which the power consumption is recorded. |
PoE Configuration
Use this screen to set the PoE settings for the Nebula Device. To access this screen, click the edit icon next to PoE Status in the Switch > Monitor > Switches: Switch Details screen.
Switch > Monitor > Switches: Switch Details: PoE Configuration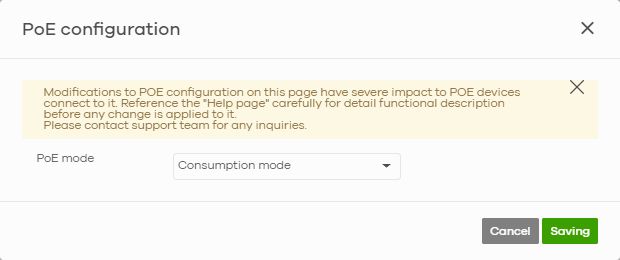
The following table describes the labels in this screen.
Label | Description |
|---|---|
PoE Mode | Select the power management mode you want the Nebula Device to use. Classification mode – Select this if you want the Nebula Device to reserve the Max Power (mW) to each powered device (PD) according to the priority level. If the total power supply runs out, PDs with lower priority do not get power to function. Consumption mode – Select this if you want the Nebula Device to manage the total power supply so that each connected PD gets a resource. However, the power allocated by the Nebula Device may be less than the Max Power (mW) of the PD. PDs with higher priority also get more power than those with lower priority levels. |
Close | Click this button to exit this screen without saving. |
Saving | Click this button to save your changes and close the screen. |
Switch Port Details
Use this to view individual Nebula Device port statistics. To access this screen, click a port in the Ports section of the Switch > Monitor > Switches: Switch Details screen or click the details link next to a port in the Switch > Configure > Switch ports screen.
Switch > Monitor > Switches: Switch Details: Port Details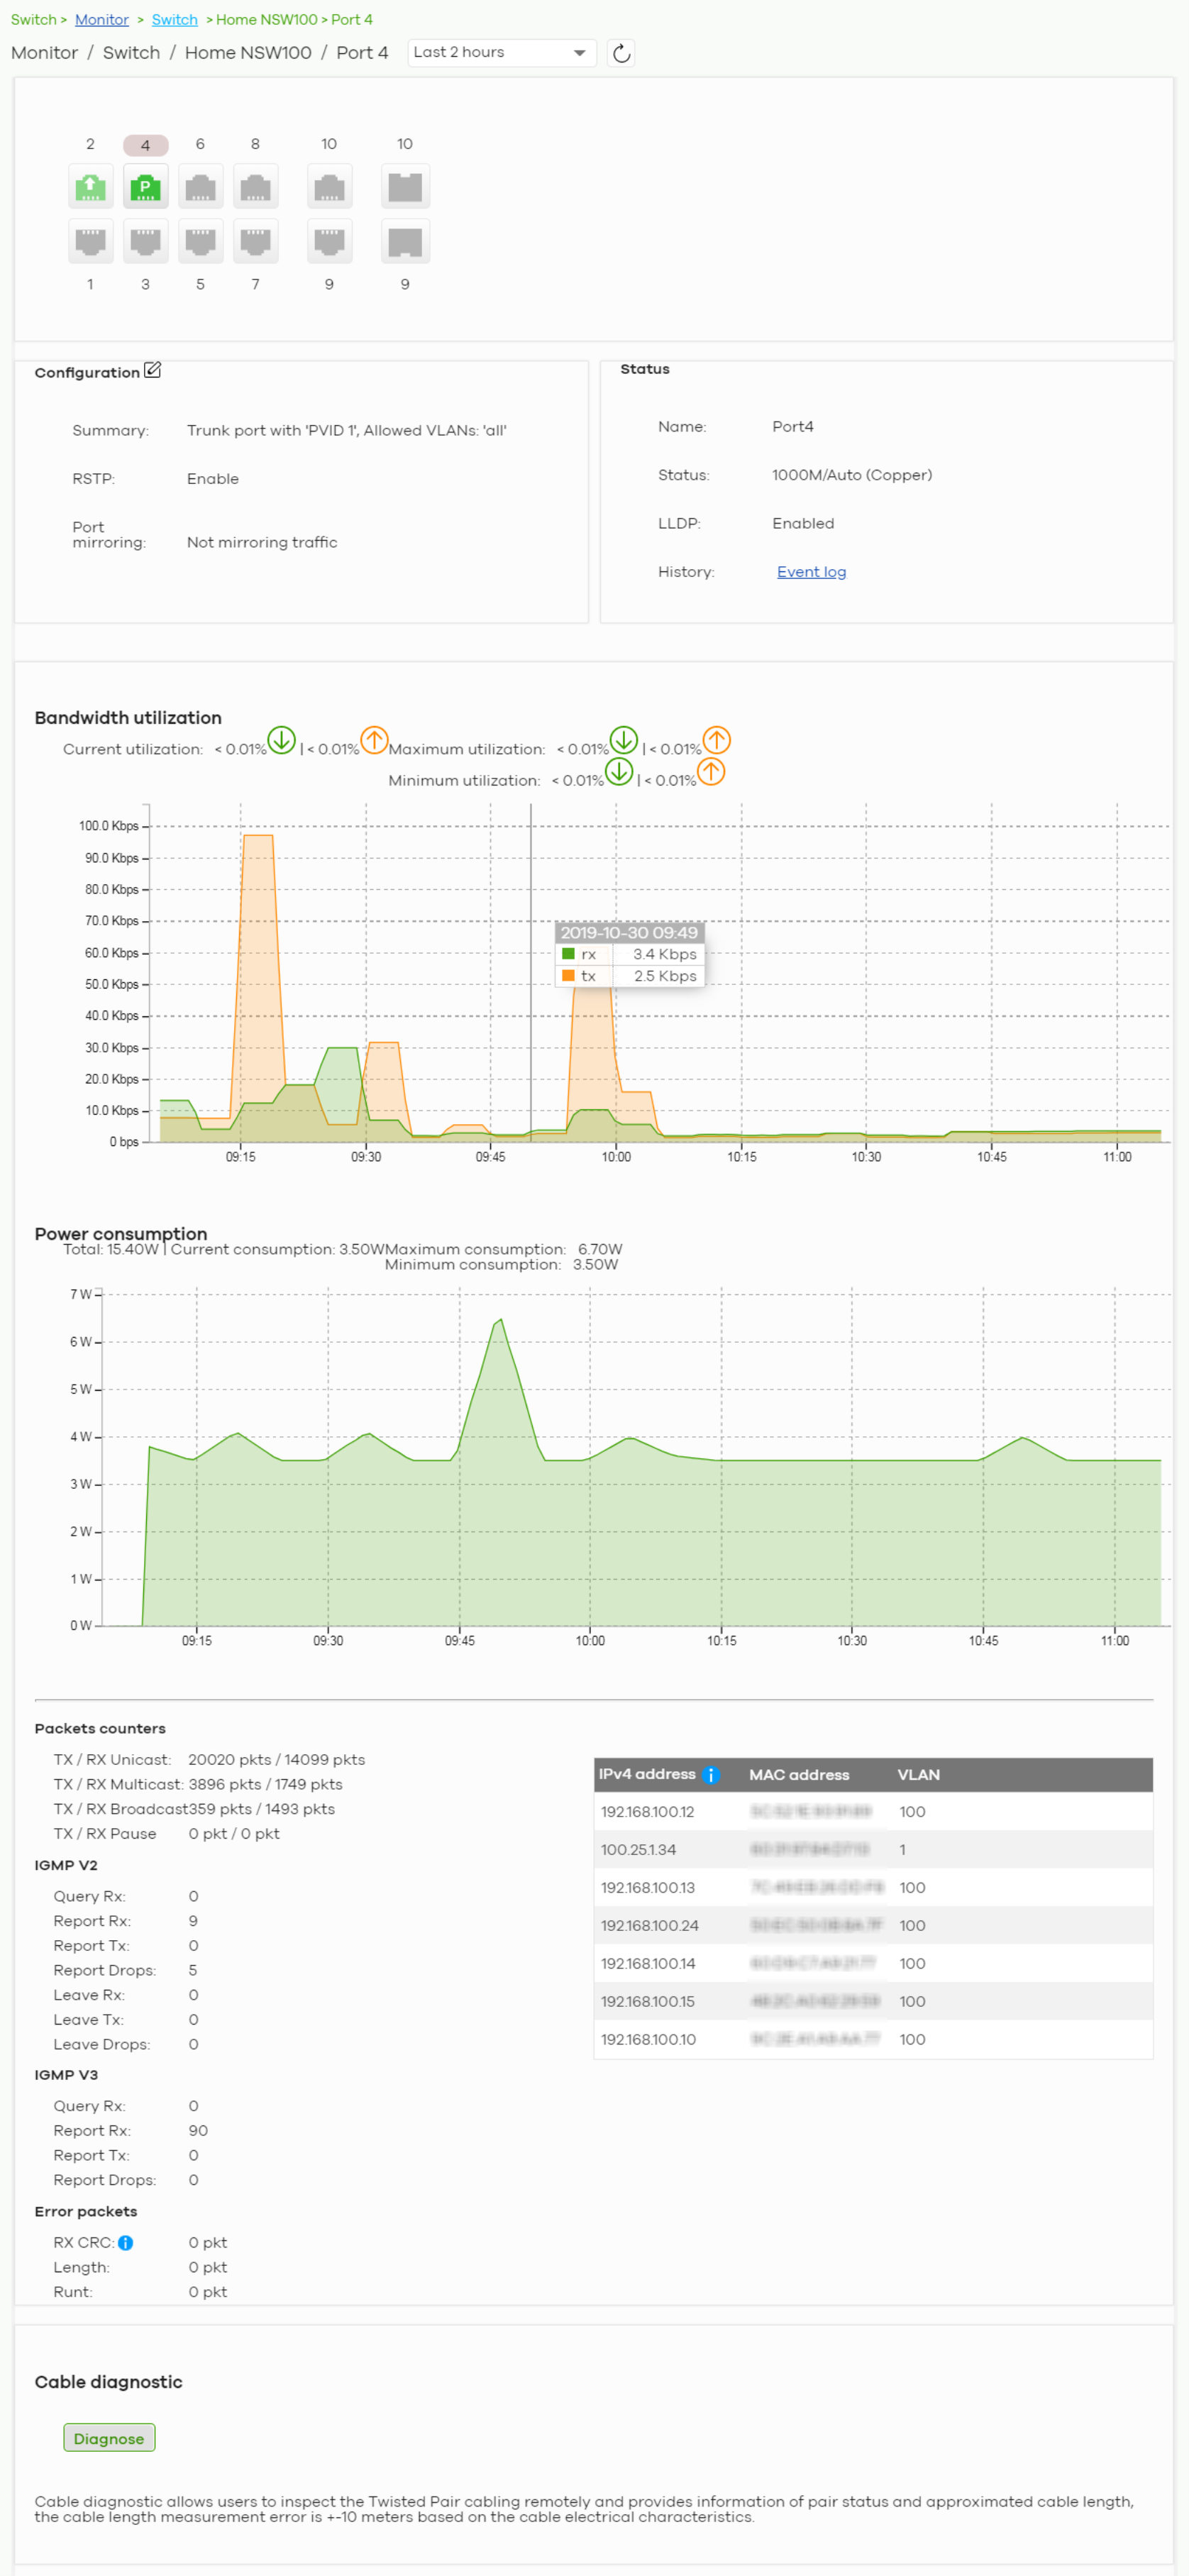
The following table describes the labels in this screen.
Label | Description |
|---|---|
Click this button to reload the data-related frames on this page. | |
Switch / Port | Select to view the port information and connection status in the past two hours, day, week or month. |
Port | This figure shows the ports on the Nebula Device. Click a port to go to the corresponding port details screen. The selected port is highlighted. Move the pointer over a port to see additional port information, such as its name, MAC address, type, and connection speed. The port color indicates the connection status of the port. • Gray (#888888): The port is disconnected. • Orange (#FF8900): The port is connected and is transmitting data at 10 or 100 Mbps. • Green (#64BE00): The port is connected and is transmitting data at 1000 Mbps (1 Gbps). • Azure (#0079FF): The port is connected and is transmitting data at 2.5 Gbps. • Violet (#8800FF): The port is connected and is transmitting data at 5 Gbps. • Blue (#004FEE): The port is connected and is transmitting data at 10000 Mbps (10 Gbps). When the port is in the STP blocking state, a blocked icon displays on top of the port ( |
Name | This shows the descriptive name of the port. |
Status | This shows the connection status of the port. |
MAC address | This shows the MAC address of the port. |
Type | This shows the port type (Trunk or Access), PVID, and allowed VLANs. |
Speed | This shows the current connection speed of the port. If the speed is unavailable, this displays “Ethernet”. |
LLDP | This shows the LLDP information received on the port. |
Configuration Click the edit icon to open the Switch ports screen and show the ports that match the filter criteria (the selected port number). See Switch Ports. | |
Summary | This shows the port’s VLAN settings. |
RSTP | This shows whether RSTP is disabled or enabled on the port. |
Port mirroring | This shows whether traffic is mirrored on the port. |
Status | |
Name | This shows the name of the port. |
Status | This shows the status of the port. |
LLDP | This shows the LLDP (Link Layer Discovery Protocol) information received on the port. |
History | Click Event log to go to the Switch > Monitor > Event log screen. |
Bandwidth Utilization | |
Current Utilization | This shows what percentage of the upstream/downstream bandwidth is currently being used by the port. |
Maximum Utilization | This shows the maximum upstream/downstream bandwidth utilization (in percentage). |
Minimum Utilization | This shows the minimum upstream/downstream bandwidth utilization (in percentage). |
y-axis | The y-axis represents the transmission rate in Kbps (kilobits per second). |
x-axis | The x-axis shows the time period over which the traffic flow occurred. |
Power Consumption | |
Total | This shows the total power consumption of the port. |
Current Consumption | This shows the current power consumption of the port. |
Maximum Consumption | This shows the maximum power consumption of the port. |
Minimum Consumption | This shows the minimum power consumption of the port. |
y-axis | The y-axis shows how much power is used in Watts. |
x-axis | The x-axis shows the time period over which the power consumption is recorded. |
Packets Counters | |
TX/RX Unicast | This shows the number of good unicast packets transmitted/received on the port. |
TX/RX Multicast | This shows the number of good multicast packets transmitted/received on the port. |
TX/RX Broadcast | This shows the number of good broadcast packets transmitted/received on the port. |
TX/RX Pause | This shows the number of 802.3x Pause packets transmitted/received on the port. |
IGMP V2/V3 | |
Query Rx | This shows the number of IGMP query packets received on the port. |
Report Rx | This shows the number of IGMP report packets received on the port. |
Report Tx | This shows the number of IGMP report packets transmitted on the port. |
Report Drops | This shows the number of IGMP report packets dropped on the port. |
Leave Rx | This shows the number of IGMP leave packets received on the port. |
Leave Tx | This shows the number of IGMP leave packets transmitted on the port. |
Leave Drops | This shows the number of IGMP leave packets dropped on the port. |
Error Packets | |
RX CRC | This shows the number of packets received with CRC (Cyclic Redundant Check) errors. CRC errors indicate packet errors in the network, potentially caused by mismatching Ethernet speed/duplex, bad cables or transceivers, or malfunctioning client devices. |
Length | This shows the number of packets received with a length that was out of range. |
Runt | This shows the number of packets received that were too short (shorter than 64 octets), including the ones with CRC errors. |
IPv4 Address | This shows the IP address of the incoming frame which is forwarded on the port. • LLDP remote information • Information collected by the Nebula Security Gateway (NSG) in this site • Information collected by NCC when the client connected to Nebula |
MAC Address | This shows the MAC address of the incoming frame which is forwarded on the port. |
VLAN | This shows the VLAN group to which the incoming frame belongs. |
Cable Diagnostics | |
Diagnose | Click Diagnose to perform a physical wire-pair test of the Ethernet connections on the port. The following fields display when you diagnose a port. |
Channel | An Ethernet cable usually has four pairs of wires. A 10BASE-T or 100BASE-TX port only use and test two pairs, while a 1000BASE-T port requires all four pairs. This displays the descriptive name of the wire-pair in the cable. |
Pair Status | OK: The physical connection between the wire-pair is okay. Open: There is no physical connection (an open circuit detected) between the wire-pair. Short: There is a short circuit detected between the wire-pair. Unknown: The Nebula Device failed to run cable diagnostics on the cable connected to this port. Unsupported: The port is a fiber port or it is not active. |
Cable Length | This displays the total length of the Ethernet cable that is connected to the port when the Pair Status is OK and the Nebula Device chipset supports this feature. This shows N/A if the Pair Status is Open or Short. Check the Distance to fault. This shows Unsupported if the Nebula Device chipset does not support to show the cable length. |
Distance to fault (m) | This displays the distance between the port and the location where the cable is open or shorted. This shows N/A if the Pair Status is OK. This shows Unsupported if the Nebula Device chipset does not support to show the distance. |
DDMI | This section is available only on an SFP (Small Form Factor Pluggable) port. |
DDMI | Click DDMI (Digital Diagnostics Monitoring Interface) to display real-time SFP transceiver information and operating parameters on the port. You can also see the alarm and warning thresholds for temperature, voltage, transmission bias, transmission and receiving power. |
Port | This shows the number of the port on the Nebula Device. |
Vendor | This shows the vendor name of the transceiver installed in the port. |
PN | This shows the part number of the transceiver installed in the port. |
SN | This shows the serial number of the transceiver installed in the port. |
Revision | This shows the firmware version of the transceiver installed in the port. |
Date-code | This shows the date the installed transceiver’s firmware was created. |
Transceiver | This shows the type and the Gigabit Ethernet standard supported by the transceiver installed in the port. |
Calibration | This shows whether the diagnostic information is internally calibrated or externally calibrated. |
Current | This shows the current operating parameters on the port, such as transceiver temperature, laser bias current, transmitted optical power, received optical power and transceiver supply voltage. |
High Alarm Threshold | This shows the high alarm threshold for temperature, voltage, transmission bias, transmission and receiving power. A trap is sent when the operating parameter is above the threshold. |
High Warn Threshold | This shows the high warning threshold for temperature, voltage, transmission bias, transmission and receiving power. |
Low Warn Threshold | This shows the low alarm threshold for temperature, voltage, transmission bias, transmission and receiving power. A trap is sent when the operating parameter is below the threshold. |
Low Alarm Threshold | This shows the low warning threshold for temperature, voltage, transmission bias, transmission and receiving power. |
Clients
This menu item redirects to Site-Wide > Monitor > Clients, with type set to Switches clients. For details, see Clients.
Event Log
Use this screen to view Nebula Device log messages. You can enter the Nebula Device name or a key word, select one or multiple event types, or specify a date/time or even a time range to display only the log messages related to it.
Click Switch > Monitor > Event Log to access this screen.
Switch > Monitor > Event log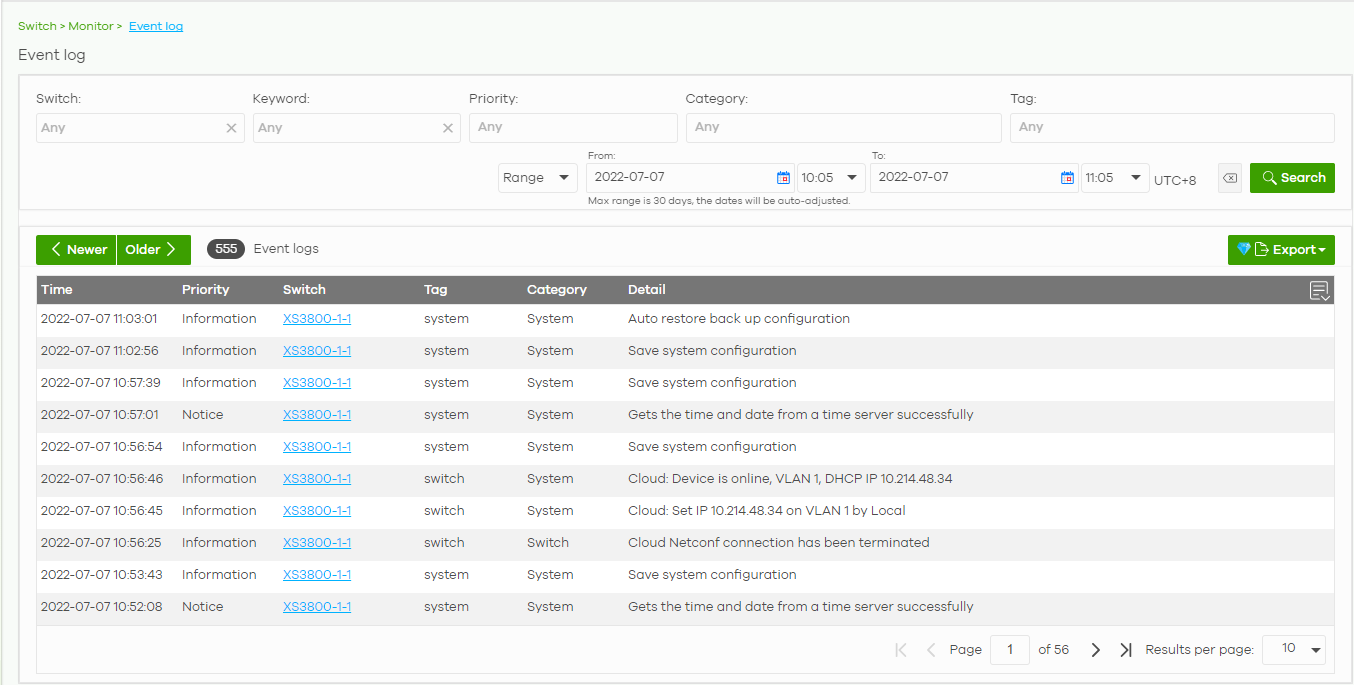
IPTV Report
Use this screen to view available IPTV channels and client information.
Click Switch > Monitor > IPTV report to access this screen.
Switch > Monitor > IPTV Report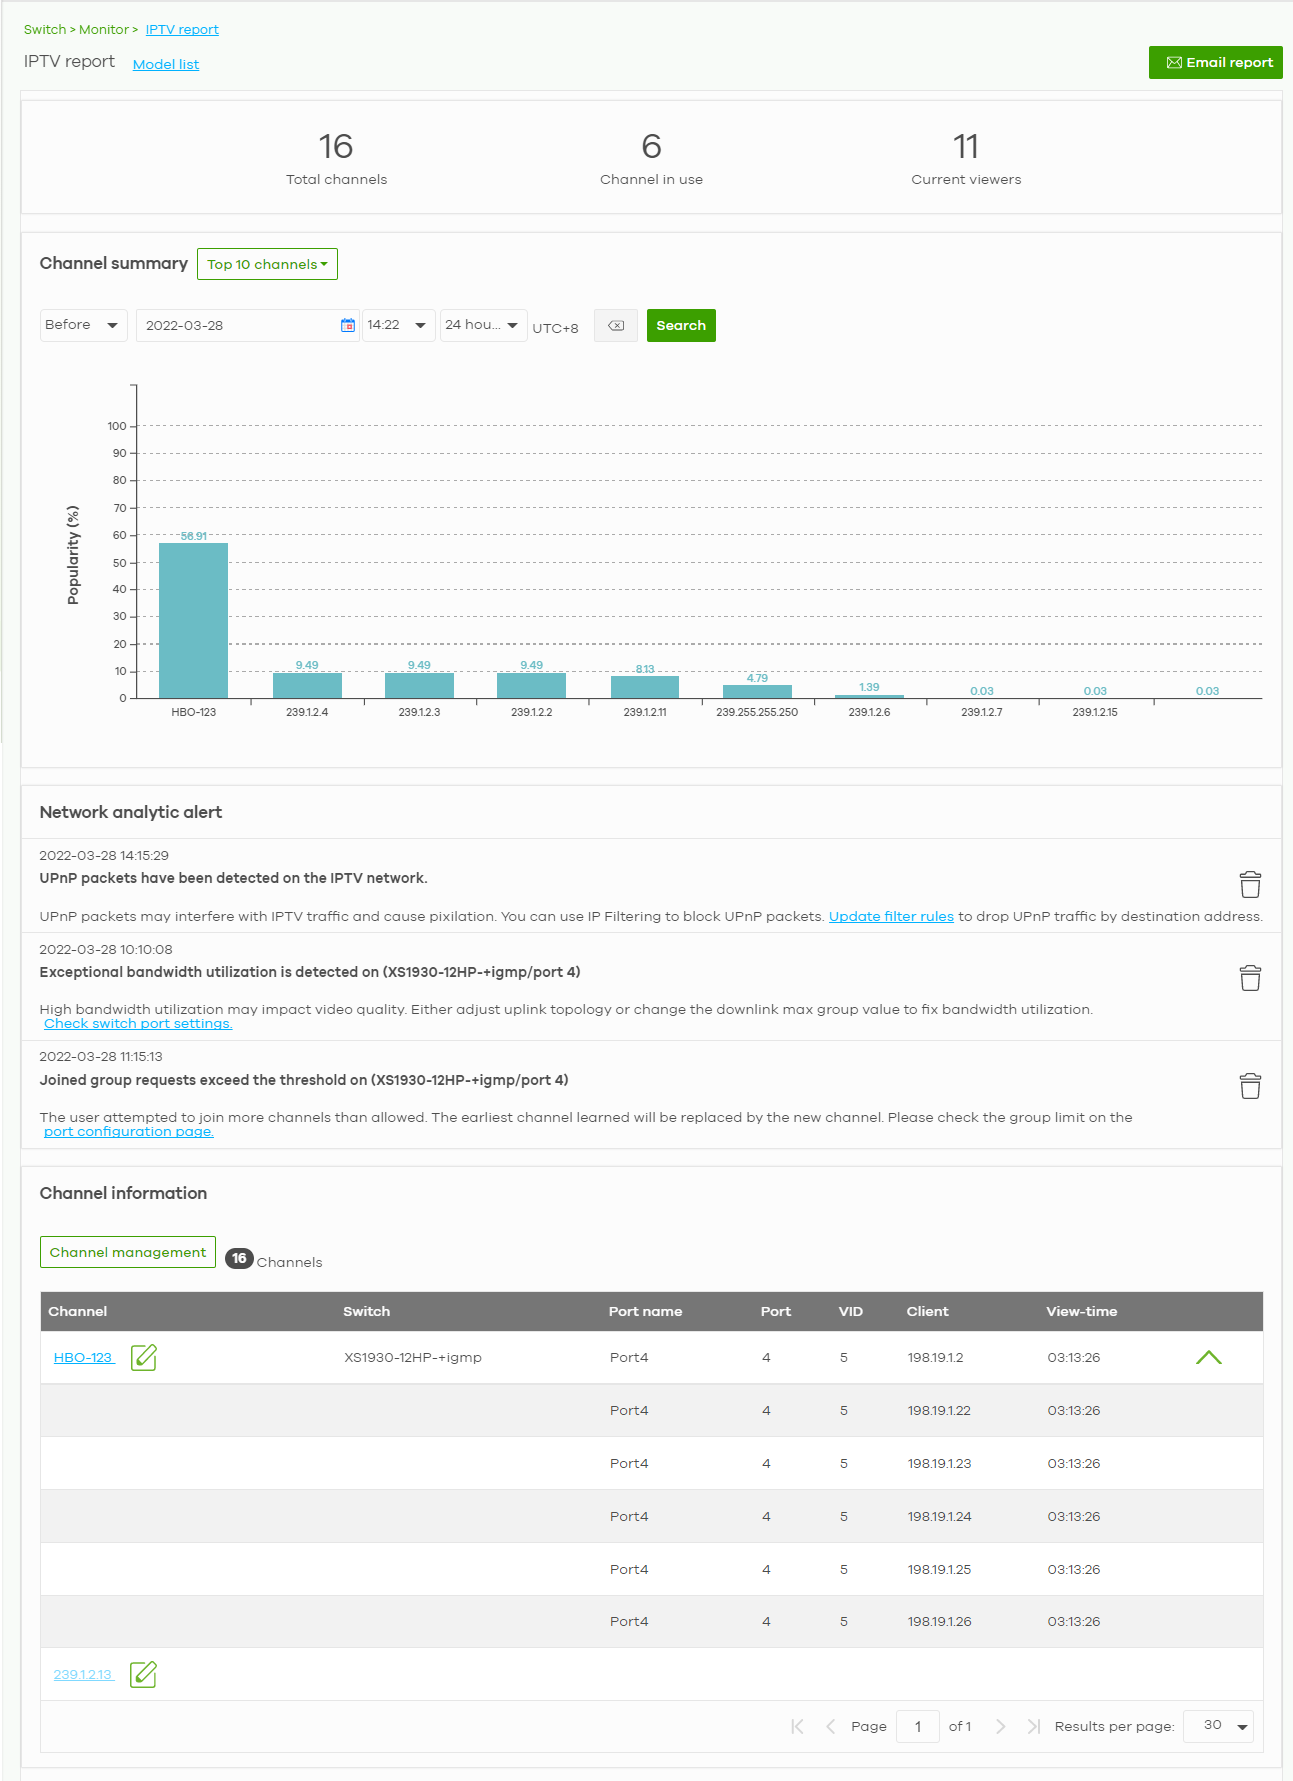
The following table describes the labels in this screen.
Label | Description |
|---|---|
IPTV report | Click Model list to show the Non-supported model list. Click See more to go to the Help > Support tools > Device function table screen. |
Email report | Click this button to send channel summary report by email, change the report logo and set email schedules. |
Total channels | This shows the total number of IPTV channels that match the search criteria. |
Channel in use | This shows the number of channels that are being watched by IPTV clients. |
Current viewers | This shows the number of clients who are watching the IPTV channels. |
Channel Summary | |
Select to view the channels according to the ranking. Alternatively, select Select channels to choose specific channels and click Apply. | |
Search | Specify a date/time and select to view the channels available in the past day, week or month before the specified date/time after you click Search. You can also select Range in the second field, set a time range and click Search to display only the channels available within the specified period of time. |
y-axis | The y-axis represents the Popularity (%) of IPTV channels. |
x-axis | The x-axis shows the name of the IPTV channel. It shows the channel’s multicast group address by default. |
Network Analytic Alert | This shows the alerts the NCC generates when an error or something abnormal is detected on the IPTV network. For example, the maximum number of the IGMP multicast groups (TV channels) a Nebula Device port can join is reached and new groups replace the earliest ones, UPnP packets are detected on the IPTV network and may interfere with IPTV traffic to cause TV pixelation, or high bandwidth usage on a certain Nebula Device port results in loss of video quality. |
Channel Information | |
Channel Management | Download the channel list and import multiple records for faster channel naming. Click Add to add new channels. 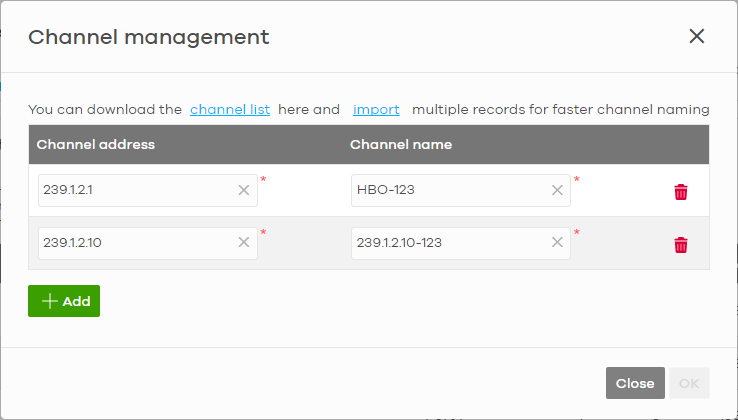 |
Channel | This shows the name of the channel. Click the edit icon to change the channel name. Click the channel name to display the channel’s client statistics. See Channel Information. |
Switch | This shows the name of the Nebula Device to which the client is connected. |
Port Name | This shows the name of the Nebula Device port to which the client is connected. |
Port | This shows the number of the Nebula Device port to which the client is connected. |
VID | This shows the ID number of the VLAN to which the Nebula Device port belongs. |
Client | This shows the IP address of the client who is watching the TV program on the channel. |
View-time | This shows the amount of time the client has spent watching the IPTV channel. |
Email Report
Use this screen to configure the email recipient’s address, change the logo and set email schedules. To access this screen, click the Email report button in the Switch > Monitor > IPTV Report screen.
Switch > Monitor > IPTV Report: Email report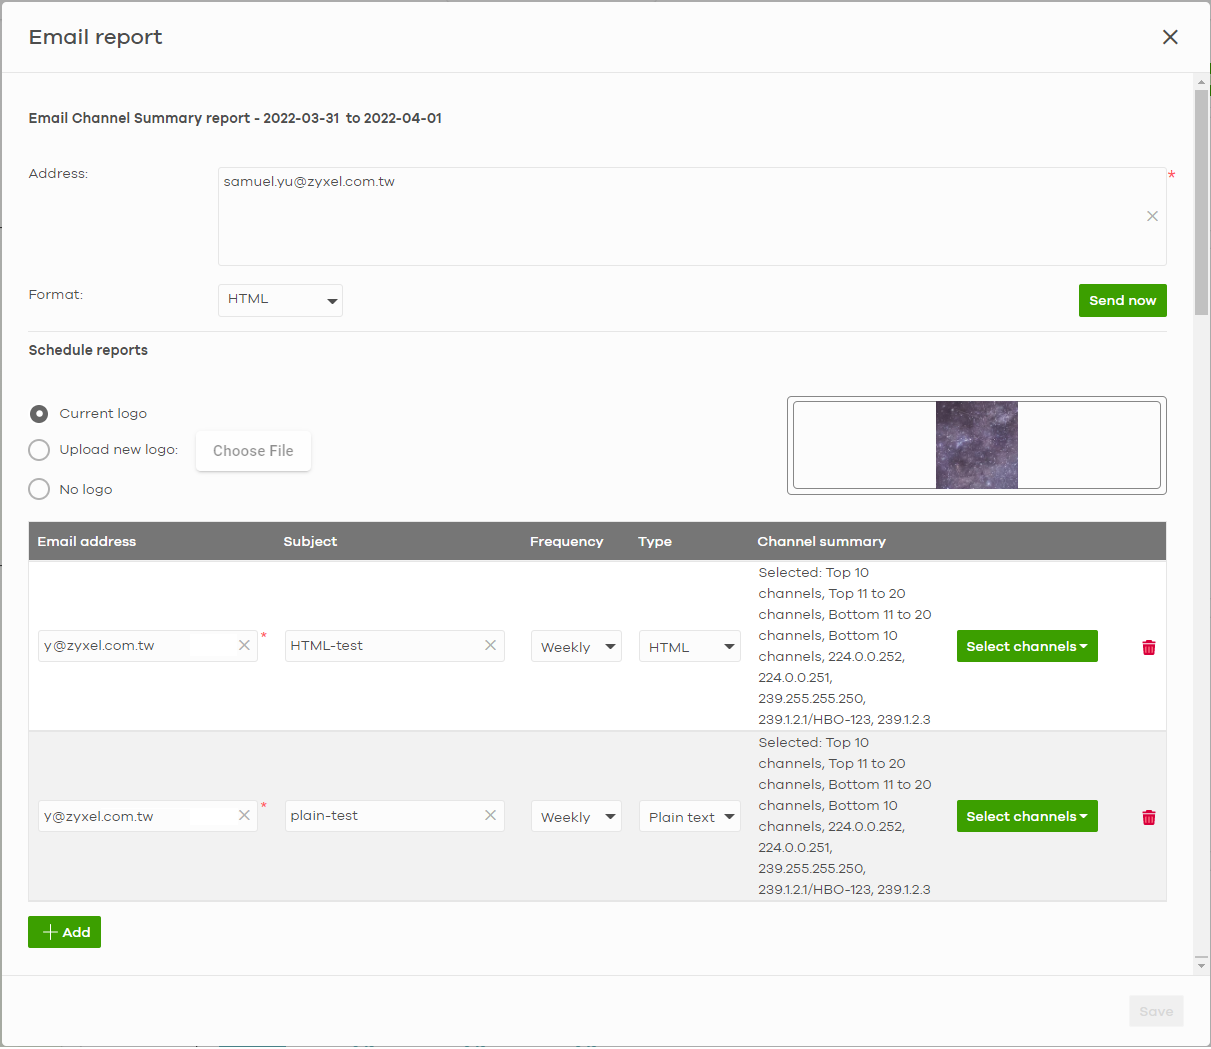
The following table describes the labels in this screen.
Label | Description |
|---|---|
Email Channel Summary report | This shows the range of the date/time you specified in the Switch > Monitor > IPTV Report screen. |
Address | Enter the recipient’s email address of the IPTV channel summary report. |
Format | Select to send the IPTV channel summary report in HTML or Plain text format. |
Send now | Click this button to send the IPTV channel summary report now. |
Schedule reports | |
logo | This shows the logo image that you uploaded for the customized IPTV channel summary report. Select Current logo to continue using the present logo. Select Upload new logo and click Choose File to locate the logo graphic. You can use the following image file formats: GIF, PNG, or JPG. File size must be less than 200 KB, and images larger than 244 x 190 will be resized. Select No logo if you do not want a logo to appear on the IPTV channel summary report. |
+ Add | Click this button to add a scheduled IPTV channel summary report profile. |
Email address | Enter the recipient’s email address of the IPTV channel summary report. |
Subject | Enter the subject of the IPTV channel summary report. |
Frequency | Select to send the IPTV channel summary report Monthly, Weekly, or Daily. |
Type | Select to send the IPTV channel summary report in HTML or Plain text format. |
Channel summary | |
Select to view the channels report according to the ranking. Alternatively, select Select channels to choose specific channels and click Update. | |
Remove | Click this to delete a scheduled profile. |
Save | Click Save to save the new scheduled profile. |
Channel Information
Use this screen to view the IPTV channel’s client information and statistics. To access this screen, click a channel name from the Channel Information list in the Switch > Monitor > IPTV Report screen.
Switch > Monitor > IPTV Report: Channel Information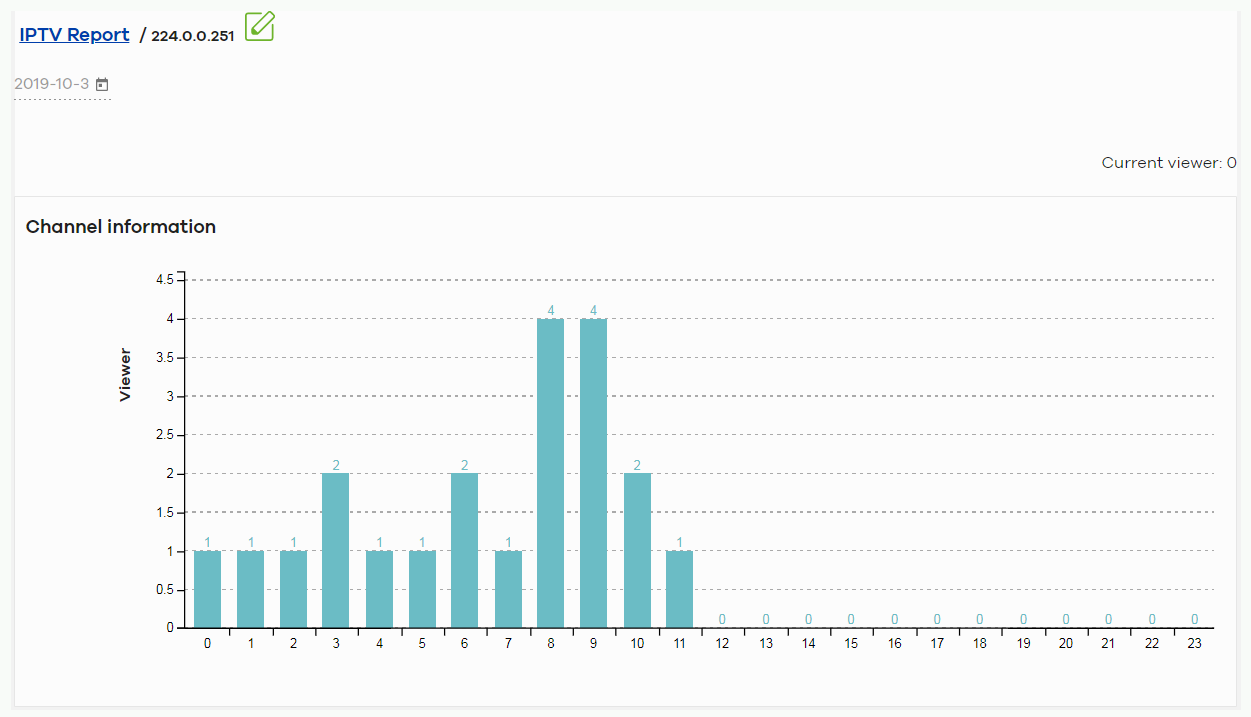
The following table describes the labels in this screen.
Label | Description |
|---|---|
Select a specific date to display only the clients who watch the IPTV channel on that day. | |
Current Viewer | This shows the number of clients who are currently watching the IPTV channel. |
y-axis | The y-axis shows the number of clients watching the IPTV channel. |
x-axis | The x-axis shows the hour of the day in 24-hour format. |
Switch | This shows the name of the Nebula Device to which the client is connected. |
Port Name | This shows the name of the Nebula Device port to which the client is connected. |
Port | This shows the number of the Nebula Device port to which the client is connected. |
VID | This shows the ID number of the VLAN to which the Nebula Device port belongs. |
Client | This shows the IP address of the client who is watching the TV program on the channel. |
View-time | This shows the amount of time the client has spent watching the IPTV channel. |
Surveillance
Use this screen to view information about Powered Devices (PDs) connected to ports on the Nebula Device.
Click Switch > Monitor > Surveillance to access this screen.
Switch > Monitor > Surveillance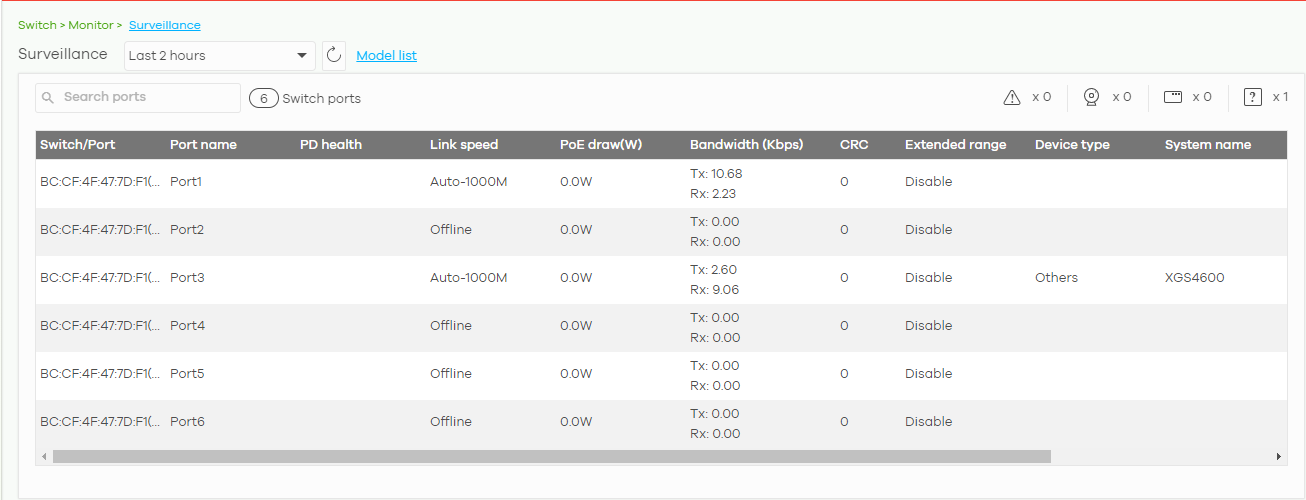
The following table describes the labels in this screen.
Label | Description |
|---|---|
Search ports | Enter a keyword to filter the list of ports or devices. |
N switch ports | This shows the number of Nebula Device ports (N) in the list. |
This shows the number of connected PDs that did not respond to an automatic PD alive check. | |
This shows the number of ONVIF-compatible IP camera devices connected to Nebula Devices in the site. | |
This shows the number of ONVIF-compatible NVR devices connected to Nebula Devices in the site. | |
This shows the number of connected devices that did not respond to an ONVIF discovery query, or are of an unknown type. | |
Switch/Port | This shows the port number of the Nebula Device. |
Port name | This shows the port description on the Nebula Device. |
PD health | This shows the status of auto PD recovery on this port. • Red: The Nebula Device failed to get information from the PD connected to the port using LLDP, or the connected PD did not respond to the Nebula Device’s ping requests. • Yellow: The Nebula Device is restarting the connected PD by turning the power off and turning it on again. • Green: The Nebula Device successfully discovered the connected PD using LLDP or ping. • --: Auto PD Recovery is not enabled on the Nebula Device and/or the port, or the switch is not supplying power to the connected PD. |
Link speed | This shows the speed (either 10M for 10 Mbps, 100M for 100 Mbps, or 1G for 1 Gbps) and the duplex (F for full duplex or H for half). This field displays Down if the port is not connected to any device. |
PoE draw(W) | This shows the total power that the connected PD draws from the port, in watts. This allows you to plan and use within the power budget of the Nebula Device. |
Bandwidth (Kbps) | Tx shows the number of kilobytes per second transmitted on this port. Rx shows the number of kilobytes per second received on this port. |
CRC | This shows the number of packets received with CRC (Cyclic Redundant Check) errors. |
Extended range | This shows whether extended range is enabled on the port. |
Device type | This shows the device type of the PD, as reported by ONVIF discovery. |
System name | This shows the name of the connected PD, as reported by ONVIF or LLDP. |
IP | This shows the IP address of the connected PD, as reported by ONVIF or LLDP. |
Discovered devices | This shows how many devices are connected to the port. Click the number to go to the Surveillance Port Details screen. |
Surveillance Port Details
Use this screen to view detailed information about a port on the Surveillance screen.
Go to Switch > Monitor > Surveillance and click on a value in the Discovered Devices column to access this screen.
Switch > Monitor > Surveillance > Port Details
The following table describes the labels in this screen.
Label | Description |
|---|---|
Status | |
Link speed | This shows the speed (either 10M for 10 Mbps, 100M for 100 Mbps, or 1G for 1 Gbps) and the duplex (F for full duplex or H for half). This field displays Down if the port is not connected to any device. |
PoE draw | This shows the total power that the connected PD draws from the port, in watts. This allows you to plan and use within the power budget of the Nebula Device. |
PD health | This shows the status of auto PD recovery on this port. • Red: The Nebula Device failed to get information from the PD connected to the port using LLDP, or the connected PD did not respond to the Nebula Device’s ping requests. • Yellow: The Nebula Device is restarting the connected PD by turning the power off and turning it on again. • Green: The Nebula Device successfully discovered the connected PD using LLDP or ping. • --: Auto PD Recovery is not enabled on the Nebula Device and/or the port, or the Nebula Device is not supplying power to the connected PD. For details on configuring auto PD recovery on a port, see Switch Ports. |
Extended range | This shows whether extended range is enabled on the port. |
Bandwidth Tx/Rx (%) | Tx shows the number of kilobytes per second transmitted on this port. Rx shows the number of kilobytes per second received on this port. |
CRC | This shows the number of packets received with CRC (Cyclic Redundant Check) errors. |
Power cycle | Click Reset to power off the PD connected to the port, by temporarily disabling then re-enabling PoE. |
Neighbor detail | This section shows all clients connected to the port. |
Search clients | Search for one or more clients in the list by keyword, status, system name, port, IP address, or firmware version. |
clients | This shows the number of clients connected to this port. |
Flush | Click this to remove all offline clients from the list. |
Status | This shows whether the client is online (green) or offline (red), and whether the client is wired or wireless. |
System name | This displays the system name of the Nebula Device. |
Port | This displays the number of the Nebula Device port that is connected to the Nebula Device. |
IP | This shows the IP address of the Nebula Device. |
Firmware | This shows the firmware version currently installed on the Nebula Device. |
Description | This shows the descriptive name of the Nebula Device. |
Summary Report
This screen displays network statistics for Nebula Devices of the selected site, such as bandwidth usage, top ports and/or top Nebula Devices.
Click Switch > Monitor > Summary Report to access this screen.
Switch > Monitor > Summary Report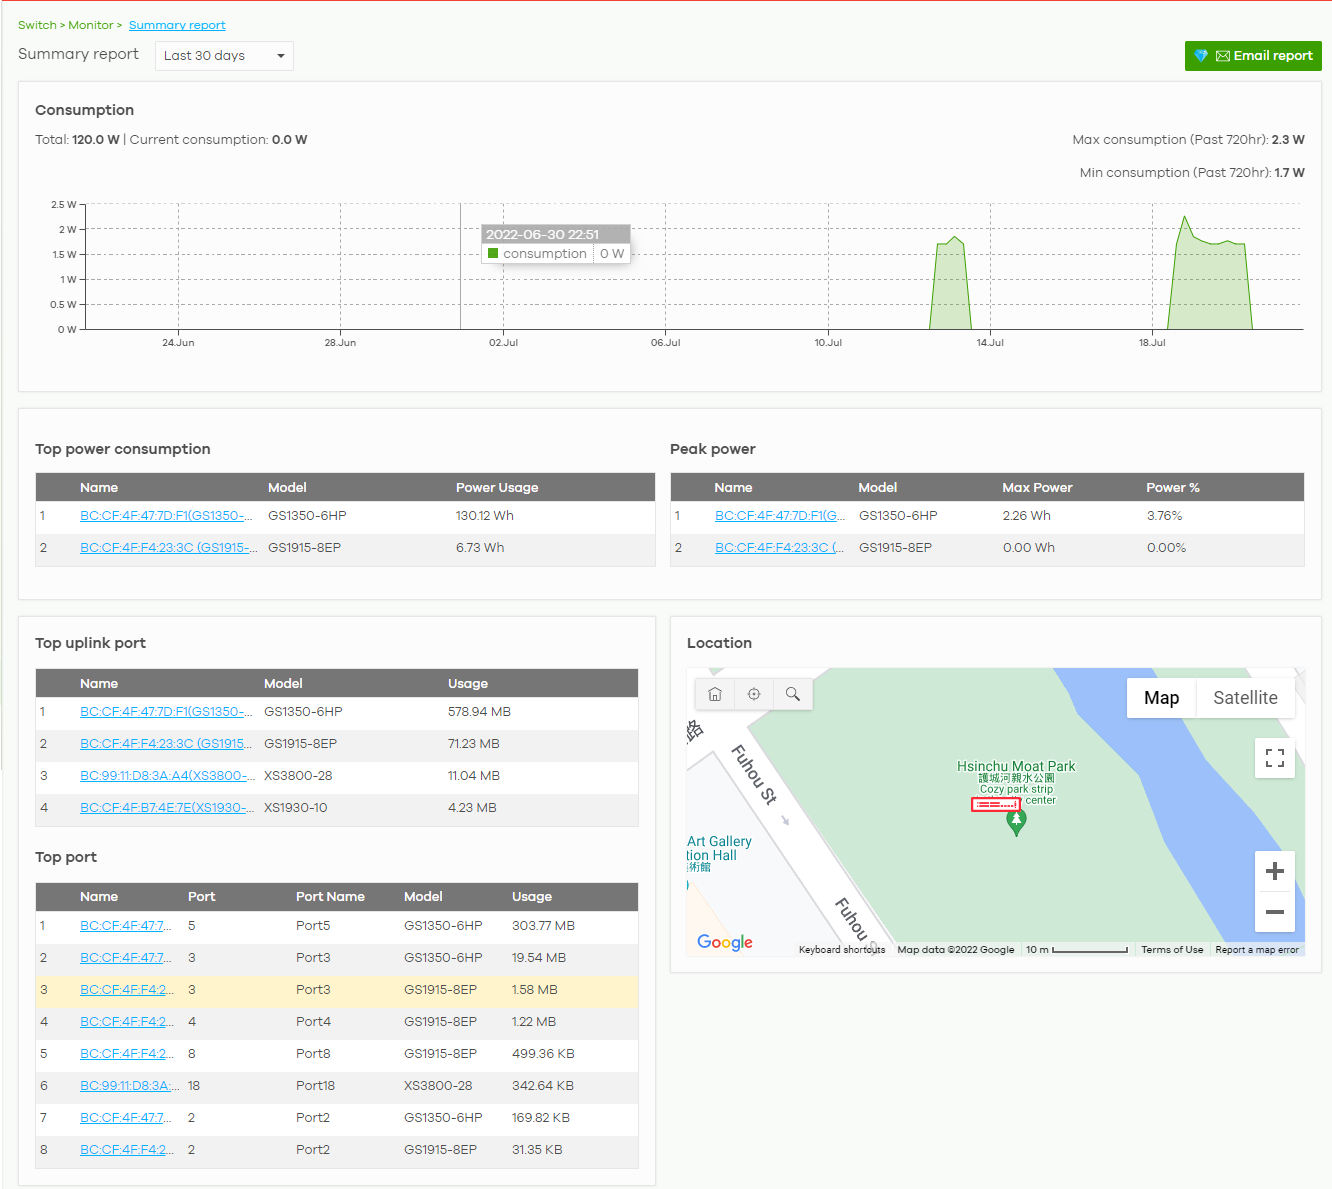
The following table describes the labels in this screen.
Label | Description |
|---|---|
Switch – Summary report | Select to view the report for the past day, week or month. Alternatively, select Custom range... to specify a time period the report will span. You can also select the number of results you want to view in a table. |
Email report | Click this button to send summary reports by email, change the logo and set email schedules. |
Consumption | |
Total | This shows the total power consumption of the Nebula Device ports. |
Current Consumption | This shows the current power consumption of the Nebula Device ports. |
Max Consumption | This shows the maximum power consumption of the Nebula Device ports. |
Min Consumption | This shows the minimum power consumption of the Nebula Device ports. |
y-axis | The y-axis shows how much power is used in Watts. |
x-axis | The x-axis shows the time period over which the power consumption is recorded. |
Top power consumption | |
# | This shows the ranking of the Nebula Device. |
Name | This shows the descriptive name of the Nebula Device. |
Model | This shows the model number of the Nebula Device. |
Power Usage | This shows the total amount of power consumed by the Nebula Device’s connected PoE devices during the specified period of time. |
Peak Power | |
# | This shows the ranking of the Nebula Device. |
Name | This shows the descriptive name of the Nebula Device. |
Model | This shows the model number of the Nebula Device. |
Max Power | This shows the maximum power consumption for the Nebula Device’s connected PoE devices during the specified period of time. |
Power % | This shows what percentage of the Nebula Device’s total power budget has been consumed by connected PoE powered devices. |
Top uplink port | |
# | This shows the ranking of the Nebula Device. |
Name | This shows the descriptive name of the Nebula Device. |
Model | This shows the model number of the Nebula Device. |
Usage | This shows the amount of data that has been transmitted through the Nebula Device’s uplink port. |
Top port | |
# | This shows the ranking of the Nebula Device port. |
Name | This shows the descriptive name of the Nebula Device. |
Port | This shows the port number on the Nebula Device. |
Model | This shows the model number of the Nebula Device. |
Usage | This shows the amount of data that has been transmitted through the Nebula Device’s port. |
Location This shows the location of the Nebula Devices on the map. | |
Configure
Use the Configure menus to configure port setting, IP filtering, RADIUS policies, PoE schedules, and other Nebula Device settings for Nebula Devices of the selected site.
Switch Ports
Use this screen to view port summary and configure Nebula Device settings for the ports. To access this screen, click Switch > Configure > Switch ports or click the Configure ports button in the Switch > Monitor > Switch: Switch Details screen.
Switch > Configure > Switch ports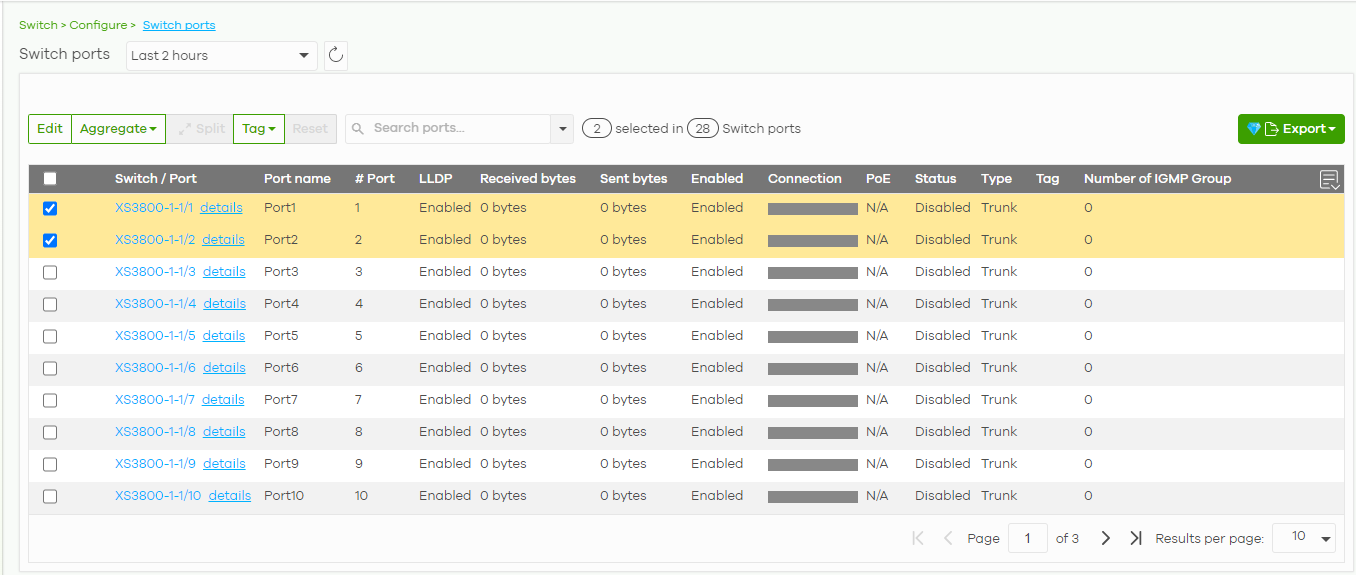
The following table describes the labels in this screen.
Label | Description |
|---|---|
Switch ports | Select to view the detailed information and connection status of the Nebula Device port in the past two hours, day, week or month. |
Click this button to reload the data-related frames on this page. | |
Edit | Select the ports you want to configure and click this button to configure Nebula Device settings on the ports, such as link aggregation, PoE schedule, LLDP and STP. |
Aggregate | Select more than one port and click this button to group the physical ports into one logical higher-capacity link. |
Split | Select a trunk group and click this button to delete the trunk group. The ports in this group then are not aggregated. A trunk group is one logical link containing multiple ports. |
Tag | Click this button to create a new tag or delete an existing tag. |
Reset | Click this button to reboot the PD (powered device) connected to the PoE port. Follow the prompt and click Confirm to reboot the PD connected to this port. |
Search | Specify your desired filter criteria to filter the list of Nebula Device ports. You can filter the search by selecting one or more Nebula Devices. Under Ports, you can search for multiple ports separated by a comma, or a range separated by a hyphen. For example: 1,2,4–6. |
Switch ports | This shows the number of ports on the Nebula Device. |
Export | Click this button to save the Nebula Device port list as a CSV or XML file to your computer. |
CRC alert icon | This prompt appears if CRC errors are detected in the port(s). Go to Switch > Monitor > Switches: Switch Details: Port Details for the details. See Switch Port Details for more information. |
Switch / Port | This shows the Nebula Device name and port number. If the port is added to a trunk group, this also shows whether it is configured as a static member of the trunk group (Static) or configured to join the trunk group through LACP (LACP). If the port is connected to an uplink gateway, it shows Uplink. Click details to display the port details screen. See Switch Port Details. |
Port name | This shows the descriptive name of the port. |
#Port | This shows the port number. |
LLDP | This shows whether Link Layer Discovery Protocol (LLDP) is supported on the port. |
Received broadcast packets | This shows the number of good broadcast packets received. |
Received bytes | This shows the number of bytes received on this port. |
Received packets | This shows the number of received frames on this port. |
Sent broadcast packets | This shows the number of good broadcast packets transmitted. |
Sent bytes | This shows the number of bytes transmitted on this port. |
Sent multicast packets | This shows the number of good multicast packets transmitted. |
Received multicast packets | This shows the number of good multicast packets received. |
Sent packets | This shows the number of transmitted frames on this port. |
Total bytes | This shows the total number of bytes transmitted or received on this port. |
Enabled | This shows whether the port is enabled or disabled. |
Link | This shows the speed of the Ethernet connection on this port. Auto (auto-negotiation) allows one port to negotiate with a peer port automatically to obtain the connection speed and duplex mode that both ends support. |
Connection | This shows the connection status of the port. • Gray (#888888): The port is disconnected. • Orange (#FF8900): The port is connected and is transmitting data at 10 or 100 Mbps. • Green (#64BE00): The port is connected and is transmitting data at 1000 Mbps (1 Gbps). • Azure (#0079FF): The port is connected and is transmitting data at 2.5 Gbps. • Violet (#8800FF): The port is connected and is transmitting data at 5 Gbps. • Blue (#004FEE): The port is connected and is transmitting data at 10000 Mbps (10 Gbps). When the port is in the STP blocking state, a blocked icon displays. Move the cursor over a time slot to see the actual date and time when a port is connected or disconnected. |
RADIUS policy | This shows the name of RADIUS authentication policy applied to the port. |
Allowed VLAN | This shows the VLANs from which the traffic comes is allowed to be transmitted or received on the port. |
PoE | This shows whether PoE is enabled on the port. |
RSTP | This shows whether RSTP is enabled on the port. |
Status | If STP/RSTP is enabled, this field displays the STP state of the port. If STP/RSTP is disabled, this field displays FORWARDING if the link is up, otherwise, it displays Disabled. |
Schedule | This shows the name of the PoE schedule applied to the port. |
Type | This shows the port type (Trunk or Access). |
PVID | This shows the port VLAN ID. It is a tag that adds to incoming untagged frames received on the port so that the frames are forwarded to the VLAN group that the tag defines. |
Tag | This shows the user-specified tag that the Nebula Device adds to the outbound traffic on this port. |
Storm Control | This shows whether traffic storm control is enabled or disabled on the port. |
Broadcast Limit (pps) | This shows the maximum number of broadcast packets the Nebula Device accepts per second on this port. |
Multicast Limit (pps) | This shows the maximum number of multicast packets the Nebula Device accepts per second on this port. |
DLF Limit (pps) | This shows the maximum number of Destination Lookup Failure (DLF) packets the Nebula Device accepts per second on this port. |
Loop Guard | This shows whether loop guard is enabled or disabled on the port. |
Network Analytic Alert | An amber alert icon displays if the NCC generates alerts when an error or something abnormal is detected on the port for the IPTV network. Move the cursor over the alert icon to view the alert details. |
IPSG protected | This shows whether IP source guard protection is enabled on this port. |
Received CRC packets | This shows the number of CRC (Cyclic Redundancy Check) errors received on the port. |
Number of IGMP Group | This shows the number of IGMP groups the port has joined. |
Click this icon to display a greater or lesser number of configuration fields. |
Update ports
Click to select the port you want to configure in the Switch > Configure > Switch ports screen.
Switch > Configure > Switch ports: Edit
The following table describes the labels in this screen.
Label | Description |
|---|---|
Switch ports | This shows the Nebula Device name and port number for the ports you are configuring in this screen. |
Name | Enter a descriptive name for the ports. |
Tags | Select or create a new tag for outgoing traffic on the ports. |
Port enabled | Select to enable or disable the ports. A port must be enabled for data transmission to occur. |
RSTP | Select to enable or disable RSTP on the ports. |
STP guard | This field is available only when RSTP is enabled on the ports. Select Root guard to prevent the Nebula Devices attached to the ports from becoming the root bridge. Select BPDU guard to have the Nebula Device shut down the ports if there is any BPDU received on the ports. Otherwise, select Disable. |
LLDP | Select to enable or disable LLDP on the ports. |
Link | Select the speed and the duplex mode of the Ethernet connection on the ports. Choices are Auto-1000M, 10M/Half Duplex, 10M/Full Duplex, 100M/Half Duplex, 100M/Full Duplex and 1000M/Full Duplex (Gigabit connections only). |
Extended range | Select to enable or disable extended range. Extended range allows the port to transmit power and data at a distance of 250 meters. |
Media type | You can insert either an SFP+ transceiver or an SFP+ Direct Attach Copper (DAC) cable into the 10 Gigabit interface of the Nebula Device. Select the media type (sfp+or DAC 10G) of the SFP+ module that is attached to the 10 Gigabit interface. |
Port Isolation | Select to enable or disable port isolation on the ports. The ports with port isolation enabled cannot communicate with each other. They can communicate only with the CPU management port of the same Nebula Device and the Nebula Device’s other ports on which the isolation feature is not enabled. |
IPSG protected | Select to enable or disable IP source guard protection on the port. |
RADIUS policy | This field is available only when you select Access in the Type field. Select the name of the pre-configured RADIUS policy that you want to apply to the ports. Select Open if you do NOT want to enable port authentication on the ports. |
Bandwidth Control | Select to enable or disable bandwidth control on the port. |
Ingress | Specify the maximum bandwidth allowed in kilobits per second (Kbps) for the incoming traffic flow on the ports. |
Egress | Specify the maximum bandwidth allowed in kilobits per second (Kbps) for the out-going traffic flow on the ports. |
Loop guard | Select to enable or disable loop guard on the ports. |
Storm Control | Select to enable or disable broadcast storm control on the ports. |
Broadcast (pps) | Specifies the maximum number of broadcast packets the Nebula Device accepts per second on the ports. |
Multicast (pps) | Specifies the maximum number of multicast packets the Nebula Device accepts per second on the ports. |
DLF (pps) | Specifies the maximum number of DLF packets the Nebula Device accepts per second on the ports. |
Type | Set the type of the port. Select Access to configure the port as an access port which can carry traffic for just one VLAN. Frames received on the port are tagged with the port VLAN ID. Select Trunk to configure the port as a trunk port which can carry traffic for multiple VLANs over a link. A trunk port is always connected to a Nebula Device or router. |
VLAN type | This field is available only when you select Access in the Type field. None: This port is a regular access port and follows the device’s access port rules. Vendor ID based VLAN: Apply the Vendor ID based VLAN settings from Switch > Configure > Switch settings to this port. Voice VLAN: Apply the Voice VLAN settings from Switch > Configure > Switch settings to this port. |
PVID | A PVID (Port VLAN ID) is a tag that adds to incoming untagged frames received on a port so that the frames are forwarded to the VLAN group that the tag defines. Enter a number between 1and 4094 as the port VLAN ID. |
Allowed VLANs | This field is available only when you select Trunk in the Type field. Specify the VLANs from which the traffic comes is allowed to be transmitted or received on the ports. |
PoE Settings | |
PoE | Select Enable to provide power to a PD connected to the ports. |
PoE schedule | This field is available only when you enable PoE. Select a pre-defined schedule (created using the Switch > Configure > PoE schedule screen) to control when the Nebula Device enables PoE to provide power on the ports. If you enable PoE and select Unschedule, PoE is always enabled on the ports. |
PoE priority | When the total power requested by the PDs exceeds the total PoE power budget on the Nebula Device, you can set the PD priority to allow the Nebula Device to provide power to ports with higher priority. Select Low to set the Nebula Device to assign the remaining power to the port after all critical and medium priority ports are served. Select Medium to set the Nebula Device to assign the remaining power to the port after all critical priority ports are served. Select Critical to give the highest PD priority on the port. |
Power up mode | Set how the Nebula Device provides power to a connected PD at power-up. 802.3at – the Nebula Device supports the IEEE 802.3at High Power over Ethernet standard and can supply power of up to 30W per Ethernet port. IEEE 802.3at is also known as PoE+ or PoE Plus. An IEEE 802.3at compatible device is referred to as Type 2. Power Class 4 (High Power) can only be used by Type 2 devices. If the connected PD requires a Class 4 current when it is turned on, it will be powered up in this mode. 802.3af – the Nebula Device follows the IEEE 802.3af Power over Ethernet standard to supply power to the connected PDs during power-up. Legacy – the Nebula Device can provide power to the connected PDs that require high inrush currents at power-up. Inrush current is the maximum, instantaneous input current drawn by the PD when first turned on. Pre-802.3at – the Nebula Device initially offers power on the port according to the IEEE 802.3af standard, and then switches to support the IEEE 802.3at standard within 75 milliseconds after a PD is connected to the port. Select this option if the Nebula Device is performing 2-event Layer-1 classification (PoE+ hardware classification) or the connected PD is NOT performing Layer 2 power classification using Link Layer Discovery Protocol (LLDP). |
Auto PD recovery | Select to enable or disable automatic PD recovery on the port. Automatic PD recovery allows the Nebula Device to restart a Powered Device (PD) connected to the port by turning the device on and off again. |
Detecting mode | Select LLDP to have the Nebula Device passively monitor current status of the connected Powered Device (PD) by reading LLDP packets from the PD on the port. Select Ping to have the Nebula Device ping the IP address of the connected Powered Device (PD) through the designated port to test whether the PD is reachable or not. |
Action | Set the action to take when the connected Powered Device (PD) has stopped responding. Select Reboot-Alarm to have the Nebula Device send an SNMP trap and generate a log message, and then turn off the power of the connected PD and turn it back on again to restart the PD. Select Alarm to have the Nebula Device send an SNMP trap and generate a log message. |
Neighbor IP | Set the IPv4 address of the Powered Device (PD) connected to this port. |
Polling Interval | Specify the number of seconds the Nebula Device waits for a response before sending another ping request. For example, the Nebula Device will try to detect the PD status by performing ping requests every 20 seconds. |
Polling Count | Specify how many times the Nebula Device resends a ping request before considering the PD unreachable. |
Resume Polling interval (sec) | Specify the number of seconds the Nebula Device waits before monitoring the PD status again after it restarts the PD on the port. |
PD Reboot Count | Specify how many times the Nebula Device attempts to restart the PD on the port. The PD Reboot Count resets if any of the following conditions are true: • The Nebula Device successfully pings the PD. • You modify any Auto PD Recovery settings and apply them. • The Nebula Device restarts. |
Resume Power Interval (sec) | Specify the number of seconds the Nebula Device waits before supplying power to the connected PD again after it restarts the PD on the port. |
IPTV Setting | |
Overwrite advanced IGMP setting | Select ON to overwrite the port’s advanced IGMP settings (configured in the Configure > Advanced IGMP screen) with the settings you configure in the fields below. Otherwise, select OFF. |
Leave Mode | Select Immediate Leave to remove this port from the multicast tree immediately when an IGMP leave message is received on this port. Select this option if there is only one host connected to this port. Select Normal Leave or Fast Leave and enter an IGMP normal/fast leave timeout value to have the Nebula Device wait for an IGMP report before the leave timeout when an IGMP leave message is received on this port. You need to specify how many milliseconds the Nebula Device waits for an IGMP report before removing an IGMP snooping membership entry when an IGMP leave message is received on this port from a host. In Normal Leave mode, when the Nebula Device receives an IGMP leave message from a host on a port, it forwards the message to the multicast router. The multicast router then sends out an IGMP Group-Specific Query (GSQ) message to determine whether other hosts connected to the port should remain in the specific multicast group. The Nebula Device forwards the query message to all hosts connected to the port and waits for IGMP reports from hosts to update the forwarding table. In Fast Leave mode, right after receiving an IGMP leave message from a host on a port, the Nebula Device itself sends out an IGMP Group-Specific Query (GSQ) message to determine whether other hosts connected to the port should remain in the specific multicast group. This helps speed up the leave process. |
Maximum Group | Select Enable and enter the maximum number of multicast groups this port is allowed to join. Once a port is registered in the specified number of multicast groups, any new IGMP join report received on this port will replace the earliest group entry in the multicast forwarding table. Otherwise, select Disable to turn off multicast group limits. |
IGMP filtering profile | An IGMP filtering profile specifies a range of multicast groups that clients connected to the Nebula Device are able to join. Select the name of the IGMP filtering profile to use for this port. Otherwise, select No Select to remove restrictions and allow the port to join any multicast group. |
Fixed router port | Select Auto to have the Nebula Device use the port as an IGMP query port if the port receives IGMP query packets. The Nebula Device forwards IGMP join or leave packets to an IGMP query port. Select Fixed to have the Nebula Device always use the port as an IGMP query port. This helps prevent IGMP network topology changes when query packet losses occur in the network. |
ACL
ACL lets you allow or block traffic going through the Nebula Devices according to the rule settings. Use this screen to configure ACL rules on the Nebula Devices.
Click Switch > Configure > ACL to access this screen.
Switch > Configure > ACL
The following table describes the labels in this screen.
Label | Description |
|---|---|
Management rules | The NCC automatically creates rules to allow traffic from/to the Nebula Control Center IP addresses in the list. |
Customization rules | |
 | Click the icon of a rule and drag the rule up or down to change the order. |
Enabled | Select the check box to turn on the rule. Otherwise, clear the check box to turn off the rule. |
Policy | Select to allow or deny traffic that matches the filtering criteria in the rule. |
Protocol | Select the type of IP protocol used to transport the traffic to which the rule is applied. |
Source MAC | Enter the source MAC address of the packets that you want to filter. |
Source IP | Enter the source IP address of the packets that you want to filter. |
Source port | Enter the source port numbers that defines the traffic type. |
Destination MAC | Enter the destination MAC address of the packets that you want to filter. |
Destination IP | Enter the destination IP address of the packets that you want to filter. |
Destination port | Enter the destination port numbers that defines the traffic type. |
VLAN | Enter the ID number of the VLAN group to which the matched traffic belongs. |
Description | Enter a descriptive name for the rule. |
Delete | Click the delete icon to remove the rule. |
Add | Click this button to create a new rule. |
IP & Routing
This screen enables you to create IP interfaces and static routes on Nebula Devices in the site. This allows you to do the following:
• Create IP interfaces on a L2 Nebula Device for management or monitoring services, such as IGMP querier, auto PD recovery, ping, and ONVIF discovery.
• Create multiple IP interface on a L3 Nebula Device to route across VLANs.
• Create an IP interface and static route to specify the next hop to a specific destination subnet.
Click Switch > Configure > IP & Routing to access this screen.
Switch > Configure > IP & Routing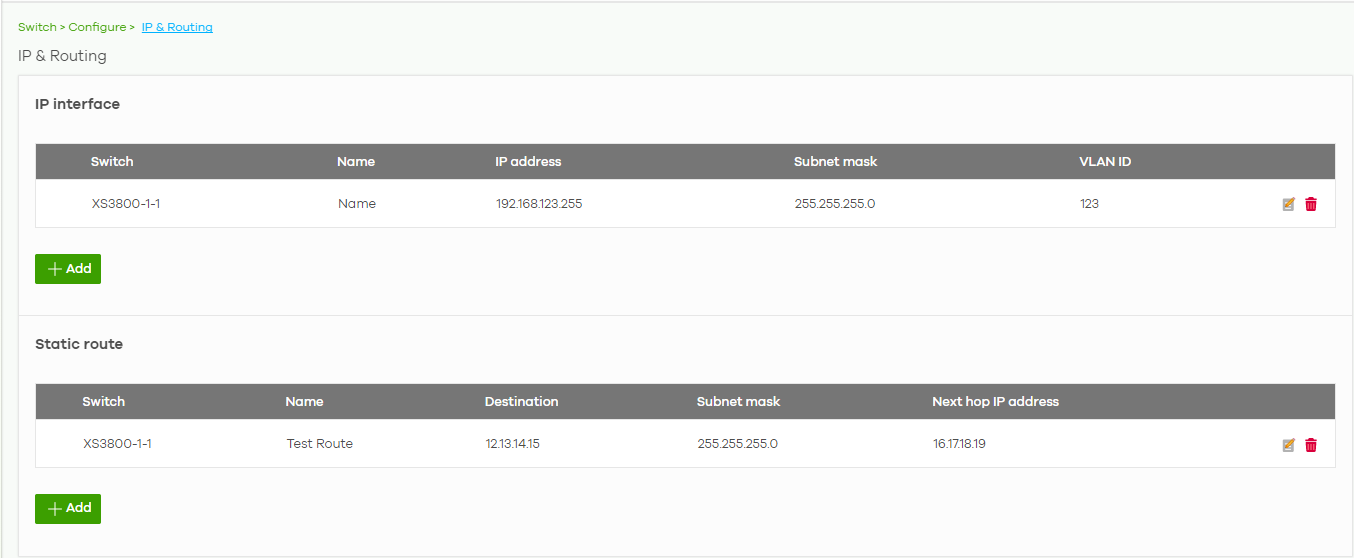
The following table describes the labels in this screen.
Label | Description |
|---|---|
IP interface | |
Switch | This shows the name of the Nebula Device. |
Name | This shows the name of the interface (network) on the Nebula Device. |
IP address | This shows the IP address of the interface (network). |
Subnet mask | This shows the subnet mask of the interface (network). |
 | Click this icon to modify the interface. |
 | Click this icon to delete the interface. |
VLAN ID | This shows the ID number of the VLAN with which the interface (network) is associated. |
+ Add | Click this button to create a new interface on a Nebula Device in the site. |
Static route | |
Switch | This shows the name of the Nebula Device. |
Name | This shows the name of the static route. |
Destination | This shows the destination IP address. |
Subnet mask | This shows the IP subnet mask. |
Next hop IP | This shows the IP address of the next-hop gateway or the interface through which the traffic is routed. The gateway is a router or Nebula Device on the same segment as your Security Appliance's interfaces. It helps forward packets to their destinations. |
| Click this icon to modify the static route. |
| Click this icon to delete the static route. |
+ Add | Click this button to create a new static route on a Nebula Device in the site. |
Add IP Interface
Click the + Add button on the Switch > Configure > IP & Routing > IP Interface screen to access this screen.
Switch > Configure > IP & Routing > IP Interface > Add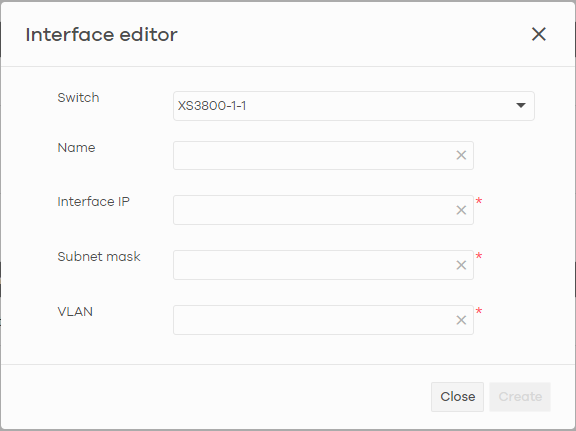
The following table describes the labels in this screen.
Label | Description |
|---|---|
Switch | Select a Nebula Device in the site on which to create the interface. |
Name | Enter a name of the interface (network) on the Nebula Device. |
IP address | Inter the IP address of the interface (network). |
Subnet mask | Enter the subnet mask of the interface (network). |
VLAN | Enter the ID number of the VLAN with which the interface (network) is associated. |
Close | Click Close to exit this screen without saving. |
Create | Click Create to save your changes and create the interface. |
Add Static Route
Click the + Add button on the Switch > Configure > IP & Routing > Static Route screen to access this screen.
Switch > Configure > IP & Routing > Static Route > Add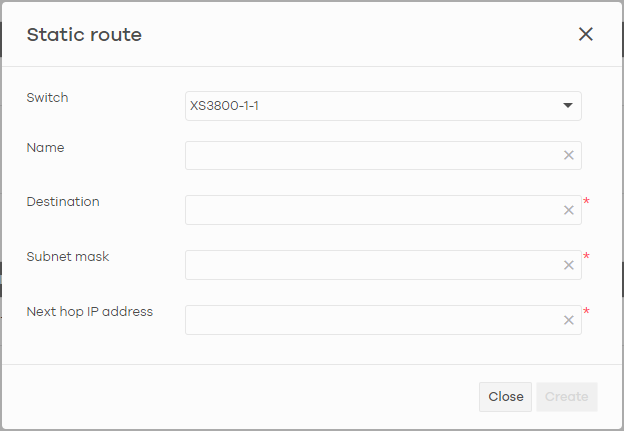
The following table describes the labels in this screen.
Label | Description |
|---|---|
Switch | Select a Nebula Device in the site on which to create the interface. |
Name | Enter a descriptive name for this route. |
Destination | Specifies the IP network address of the final destination. |
Subnet mask | Enter the IP subnet mask. |
Next hop IP address | Enter the IP address of the next-hop gateway. |
Close | Click Close to exit this screen without saving. |
Create | Click Create to save your changes and create the static route. |
ONVIF Discovery
IP-based security products use a specific protocol for communication. One of the most common protocols is ONVIF (Open Network Video Interface Forum). ONVIF is a standard interface for interoperability of IP-based security products. When ONVIF is enabled and configured on a Nebula Device, the Nebula Device can obtain information from connected ONVIF-compatible devices, such as a device’s system name and IP address.
In NCC, you can configure ONVIF-compatible Nebula Devices (for example, GS1350) in a site to discover ONVIF-compatible devices in one designated VLAN.

Configuring ONVIF Discovery
Follow these steps to configure ONVIF discovery within a site.
1 Decide on the VLAN ID you want to use for ONVIF discovery within the site. This VLAN is the ONVIF discovery VLAN.
2 Go to Switch > Configure > IP & Routing. For each Nebula Device that you want to enable ONVIF discovery on, add an IP interface for the Nebula Device on the ONVIF discovery VLAN.
3 Go to Switch > Configure > ONVIF discovery. Enable ONVIF discovery, and then set ONVIF VLAN ID to the ID of your ONVIF discovery VLAN.
4 For each Nebula Device that you want to enable ONVIF discovery on, click + Add. Select the Nebula Device, and then enter the ports that you want to listen for ONVIF devices.
ONVIF Discovery Screen
Click Switch > Configure > ONVIF discovery to access this screen.
Switch > Configure > ONVIF discovery
The following table describes the labels in this screen.
Label | Description |
|---|---|
Model list | Click this to view a list of Zyxel Nebula Device models that support ONVIF discovery. |
ONVIF discovery | Enable this to allow ONVIF-compatible Nebula Devices in the site to send ONVIF packets to discover or scan for ONVIF-compatible IP-based security devices. |
ONVIF VLAN ID | Enter the ID number of the VLAN to run ONVIF. You can enter multiple VLAN IDs separated by a comma (,). For example, enter “1,2” for VLAN IDs 1 and 2. |
Switch name | Select the Nebula Device that you want to enable ONVIF discovery on. |
Port list | Enter the port numbers to allow discovery of ONVIF-compatible devices. You can enter multiple ports separated by comma (,) or hyphen (-) without spaces. For example, enter “3-5” for ports 3, 4, and 5. Enter “3,5,7” for ports 3, 5, and 7. |
Description | Enter a descriptive name for this Nebula Device. |
Model | This shows the Nebula Device model. |
| Click this icon to delete the ONVIF configuration for the Nebula Device. |
+ Add | Click this to configure ONVIF discovery on another Nebula Device in the site. |
Advanced IGMP
A Nebula Device can passively snoop on IGMP packets transferred between IP multicast routers/Nebula Devices and IP multicast hosts to learn the IP multicast group membership. It checks IGMP packets passing through it, picks out the group registration information, and configures multi-casting accordingly. IGMP snooping allows the Nebula Device to learn multicast groups without you having to manually configure them.
The Nebula Device forwards multicast traffic destined for multicast groups (that it has learned from IGMP snooping or that you have manually configured) to ports that are members of that group. IGMP snooping generates no additional network traffic, allowing you to significantly reduce multicast traffic passing through your Nebula Device.
Use this screen to enable IGMP snooping on the Nebula Devices in the site, create IGMP filtering profiles and configure advanced IGMP snooping settings that apply to all ports on the Nebula Device for your IPTV network. Click Switch > Configure > Advanced IGMP to access this screen. You can make adjustments on a per-port basis using the Switch > Configure > Switch ports screen.
Switch > Configure > Advanced IGMP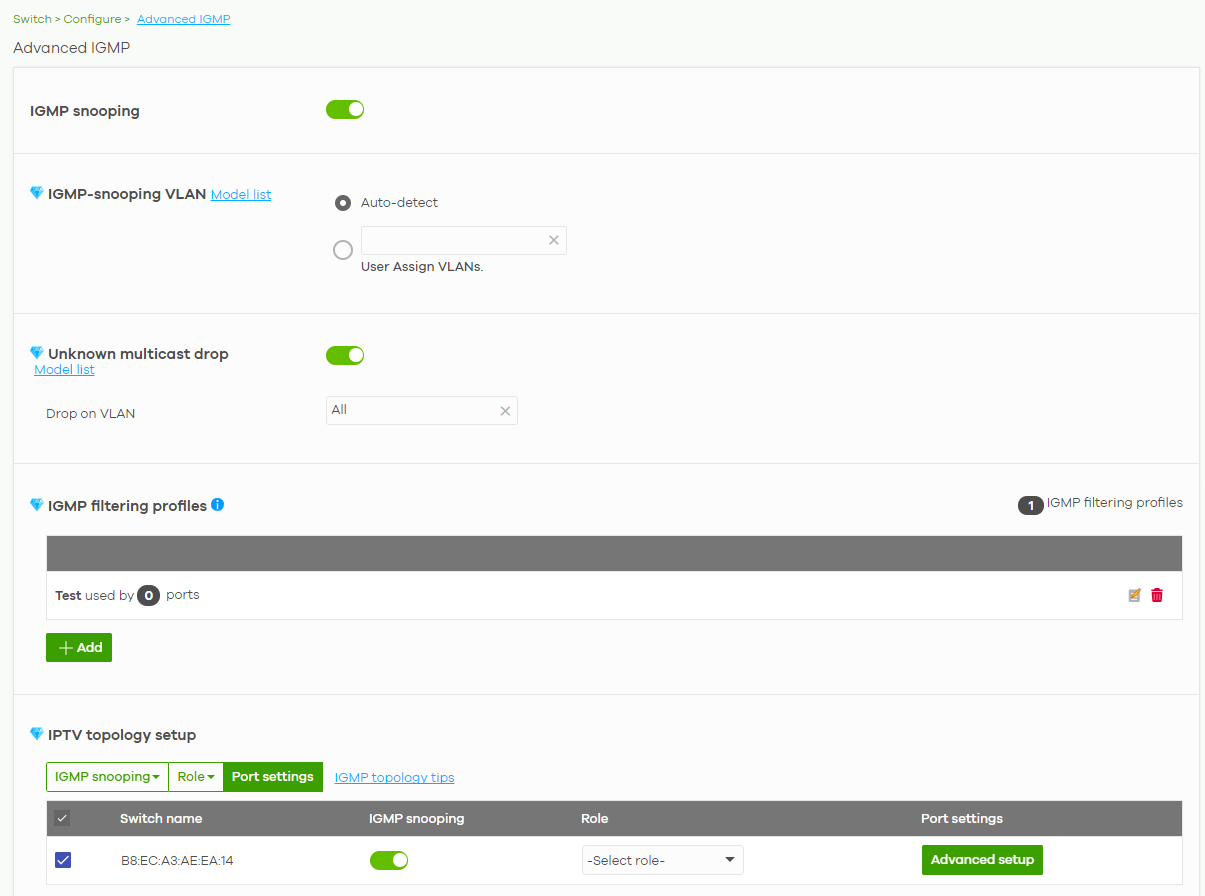
The following table describes the labels in this screen.
Label | Description |
|---|---|
IGMP snooping | Select ON to enable and configure IGMP snooping settings on all Nebula Devices in the site. Select OFF to disable it. |
IGMP-snooping VLAN | Select Auto-detect to have the Nebula Device learn multicast group membership information of any VLANs automatically. Select User Assigned VLANs and enter the VLAN IDs to have the Nebula Device only learn multicast group membership information of the VLANs that you specify. Click Model List to view a list of Zyxel Nebula Device models that do not support this feature. |
Unknown multicast drop | Specify the action to perform when the Nebula Device receives an unknown multicast frame. Select ON to discard the frames. Select OFF to send the frames to all ports. Click Model List to view a list of Zyxel Nebula Device models that support this feature. |
Drop on VLAN | This allows you to define the VLANs in which unknown multicast packets can be dropped. |
IGMP filtering profiles | An IGMP filtering profile specifies a range of multicast groups that clients connected to the Nebula Device are able to join. You can set the Nebula Device to filter the multicast group join reports on a per-port basis by configuring an IGMP filtering profile and associating a port to the profile. |
| Click the edit icon to change the profile settings. See Add/Edit IGMP Filtering Profiles. |
| Click the remove icon to delete the profile. |
Add | Click this button to create a new profile. See Add/Edit IGMP Filtering Profiles. |
IPTV Topology Setup The following three buttons are available only when there are multiple Nebula Devices in the site and your administrator account has full access to this screen. | |
IGMP Snooping | Select the Nebula Devices you want to configure and click this button to turn on or off IGMP snooping on the selected Nebula Devices. |
Role | Select the Nebula Devices you want to configure and click this button to change the IGMP role of the selected Nebula Devices. |
Port Setting | Select the Nebula Devices you want to configure and click this button to open the Port Settings screen, where you can change IGMP leave mode and IGMP filtering profile for the ports on the selected Nebula Devices. See IGMP Port Settings. |
IGMP topology tips | Click this to view information about configuring your network and device roles to optimize IPTV performance. |
The following list shows you the IGMP settings for each Nebula Device in the site. | |
Switch Name | This shows the name of the Nebula Device in the site. |
IGMP Snooping | This shows whether IGMP snooping is enabled or not on the Nebula Device. |
Role | This shows whether the Nebula Device is acting as an IGMP snooping querier, aggregation Nebula Device or access Nebula Device in the IPTV network. Click the question mark to view more information about IGMP roles. |
Port Settings | Click Advanced Setup to open the Port Settings screen, where you can change IGMP leave mode and IGMP filtering profile for the ports on the Nebula Device. See IGMP Port Settings. |
The following fields display when the IGMP role of a Nebula Device is set to Querier. | |
VLAN | Enter the ID number of the VLAN on which the Nebula Device learns the multicast group membership. |
Querier IP Interface | Enter the IP address of the Nebula Device interface in IGMP querier mode. The Nebula Device acts as an IGMP querier in that network/VLAN to periodically send out IGMP query packets with the interface IP address and update its multicast forwarding table. |
Mask | Enter the subnet mask of the Nebula Device interface in IGMP querier mode. |
| Click the remove icon to delete the rule. |
Add | Click this button to create a new rule. |
Add/Edit IGMP Filtering Profiles
Use this screen to create a new IGMP filtering profile or edit an existing profile. To access this screen, click the Add button or a profile’s Edit button in the IGMP filtering profiles section of the Switch > Configure > Advanced IGMP screen.
Switch > Configure > Advanced IGMP: Add IGMP Filtering Profile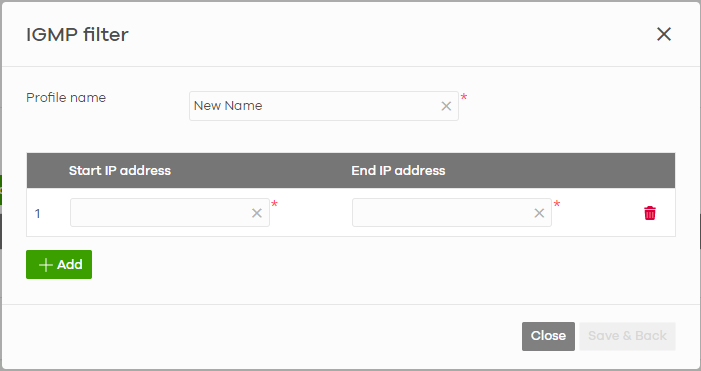
The following table describes the labels in this screen.
Label | Description |
|---|---|
Profile Name | Enter a descriptive name for this profile for identification purposes. |
Rule | This shows the index number of the rule. |
Start IP Address | Enter the starting multicast IP address for a range of multicast IP addresses that you want to belong to the IGMP filter profile. |
End IP Address | Enter the ending multicast IP address for a range of IP addresses that you want to belong to the IGMP filter profile. If you want to add a single multicast IP address, enter it in both the Start IP Address and End IP Address fields. |
| Click the remove icon to delete the rule. |
Add | Click this button to create a new rule in this profile. |
Close | Click this button to exit this screen without saving. |
Save & Back | Click this button to save your changes and close the screen. |
IGMP Port Settings
Use this screen to modify the IGMP snooping settings, such as IGMP leave mode and filtering profile for all ports on the Nebula Device. To access this screen, select one or more Nebula Devices and click the Port Setting button or click a Nebula Device’s Advanced Setup button in the IPTV Topology Setup section of the Switch > Configure > Advanced IGMP screen.
Switch > Configure > Advanced IGMP: Port Settings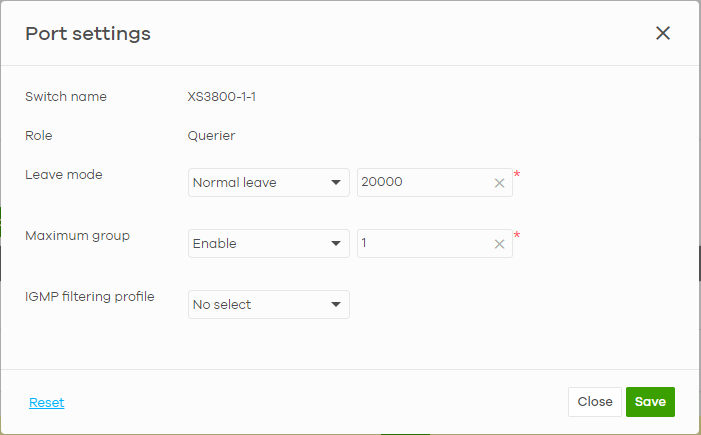
The following table describes the labels in this screen.
Label | Description |
|---|---|
Switch name | This shows the name of the Nebula Devices that you select to configure. |
Role | This shows whether the Nebula Devices you selected is an IGMP snooping querier, aggregation Nebula Device or access Nebula Device in the IPTV network. |
Leave Mode | Select Immediate Leave to set the Nebula Device to remove this port from the multicast tree immediately when an IGMP leave message is received on this port. Select this option if there is only one host connected to this port. Select Normal Leave or Fast Leave and enter an IGMP normal/fast leave timeout value to have the Nebula Device wait for an IGMP report before the leave timeout when an IGMP leave message is received on this port. You need to specify how many milliseconds the Nebula Device waits for an IGMP report before removing an IGMP snooping membership entry when an IGMP leave message is received on this port from a host. In Normal Leave mode, when the Nebula Device receives an IGMP leave message from a host on a port, it forwards the message to the multicast router. The multicast router then sends out an IGMP Group-Specific Query (GSQ) message to determine whether other hosts connected to the port should remain in the specific multicast group. The Nebula Device forwards the query message to all hosts connected to the port and waits for IGMP reports from hosts to update the forwarding table. In Fast Leave mode, right after receiving an IGMP leave message from a host on a port, the Nebula Device itself sends out an IGMP Group-Specific Query (GSQ) message to determine whether other hosts connected to the port should remain in the specific multicast group. This helps speed up the leave process. |
Maximum Group | Select Enable and enter the maximum number of multicast groups this port is allowed to join. Once a port is registered in the specified number of multicast groups, any new IGMP join report received on this port will replace the earliest group entry in the multicast forwarding table. Otherwise, select Disable to turn off multicast group limits. |
IGMP Filtering Profile | An IGMP filtering profile specifies a range of multicast groups that clients connected to the Nebula Device are able to join. Select the name of the IGMP filtering profile to use for this port. Otherwise, select No Select to remove restrictions and allow the port to join any multicast group. |
Reset | Click this button to return the screen to its last-saved settings. |
Close | Click this button to exit this screen without saving. |
Save | Click this button to save your changes and close the screen. |
RADIUS Policies
Use this screen to configure authentication servers and policies to validate access to ports on the Nebula Device using an external RADIUS server.
Click Switch > Configure > RADIUS policies to access this screen.
Switch > Configure > RADIUS policies
The following table describes the labels in this screen.
Label | Description |
|---|---|
RADIUS server | |
| Click the icon of a rule and drag the rule up or down to change the order. |
Host | Enter the IP address of the external RADIUS server. |
Port | Enter the port of the RADIUS server for authentication (default 1812). |
Secret | Enter a password (up to 32 alphanumeric characters) as the key to be shared between the external RADIUS server and the Nebula Device. |
| Click the remove icon to delete the entry. |
Add | Click this button to create a new RADIUS server entry. |
RADIUS policy | |
Password for MAC-Base Auth | Enter the password the Nebula Device sends along with the MAC address of a client for authentication with the RADIUS server. You can enter up to 32 printable ASCII characters. |
Name | Enter a descriptive name for the policy. |
RADIUS policy type | Select MAC-Base if you want to validate access to the ports based on the MAC address and password of the client. Select 802.1x if you want to validate access to the ports based on the user name and password provided by the client. |
Guest VLAN | A guest VLAN is a pre-configured VLAN on the Nebula Device that allows non-authenticated users to access limited network resources through the Nebula Device. Enter the number that identifies the guest VLAN. |
Port security | Click On to enable port security on the ports. Otherwise, select Off to disable port security on the ports. |
Limited numbers of MAC address | This field is configurable only when you enable port security. Specify the maximum number of MAC addresses that may be learned on a port. |
Switch ports | This shows the number of the Nebula Device ports to which this policy is applied. |
| Click the remove icon to delete the profile. |
Add | Click this button to create a new policy. |
PoE Schedules
Use this screen to view and configure Power over Ethernet (PoE) schedules which can be applied to the ports. PoE is enabled at the specified time/date. Click Switch > Configure > PoE schedules to access this screen.
The table shows the name of the existing schedules and the number of ports to which a schedule is applied. Click a schedule’s edit icon to modify the schedule settings or click the Add button to create a new schedule. See Create new schedule.
Switch > Configure > PoE schedules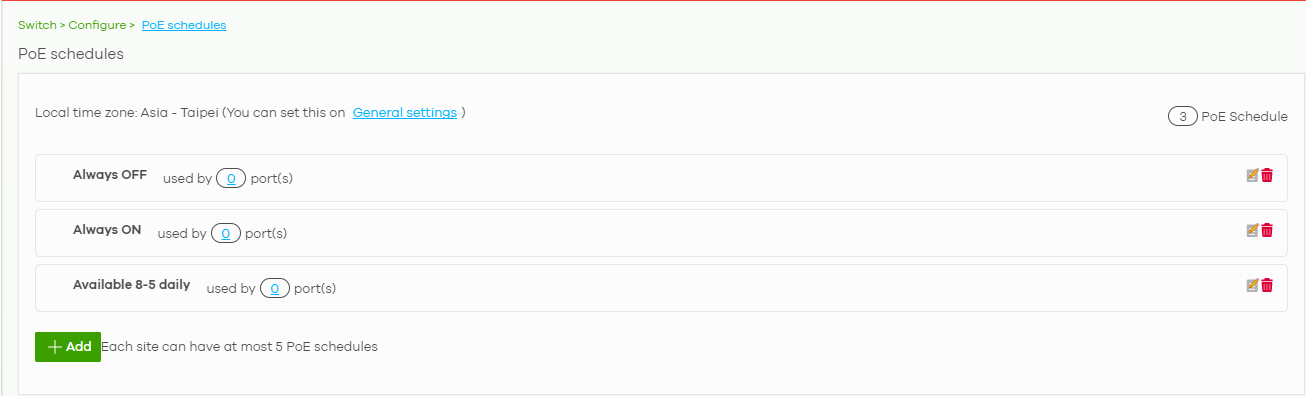
Create new schedule
Click the Add button in the Switch > Configure > PoE schedule screen to access this screen.
Switch > Configure > PoE schedule: Add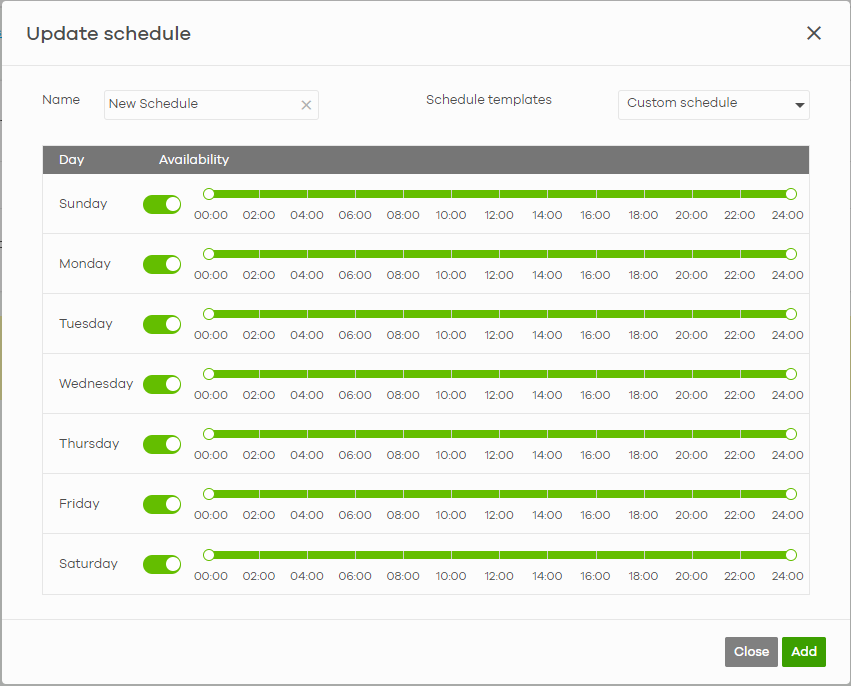
The following table describes the labels in this screen.
Label | Description |
|---|---|
Name | Enter a descriptive name for this schedule for identification purposes. |
Schedule templates | Select a pre-defined schedule template or select Custom schedule and manually configure the day and time at which PoE is enabled. |
Day | This shows the day of the week. |
Availability | Click On to enable PoE at the specified time on this day. Otherwise, select Off to turn PoE off on the day and at the specified time. Specify the hour and minute when the schedule begins and ends each day. |
Close | Click this button to exit this screen without saving. |
Add | Click this button to save your changes and close the screen. |
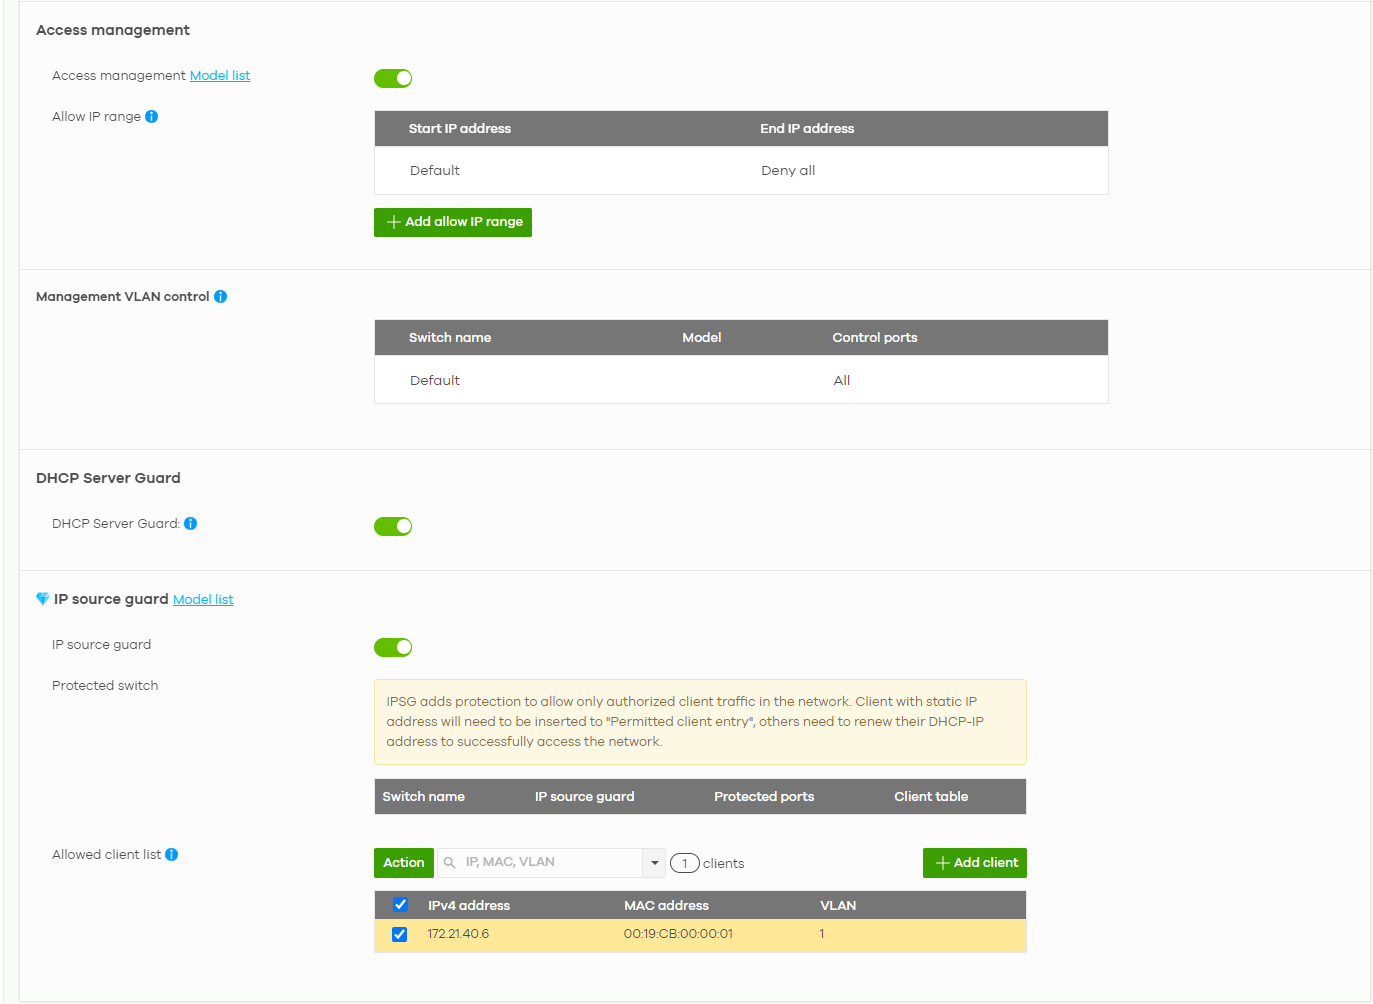
Switch Settings
Use this screen to configure global Nebula Device settings, such as (R)STP, QoS, port mirroring, voice VLAN and DHCP server guard.
Click Switch > Configure > Switch settings to access this screen.
Switch > Configure > Switch settings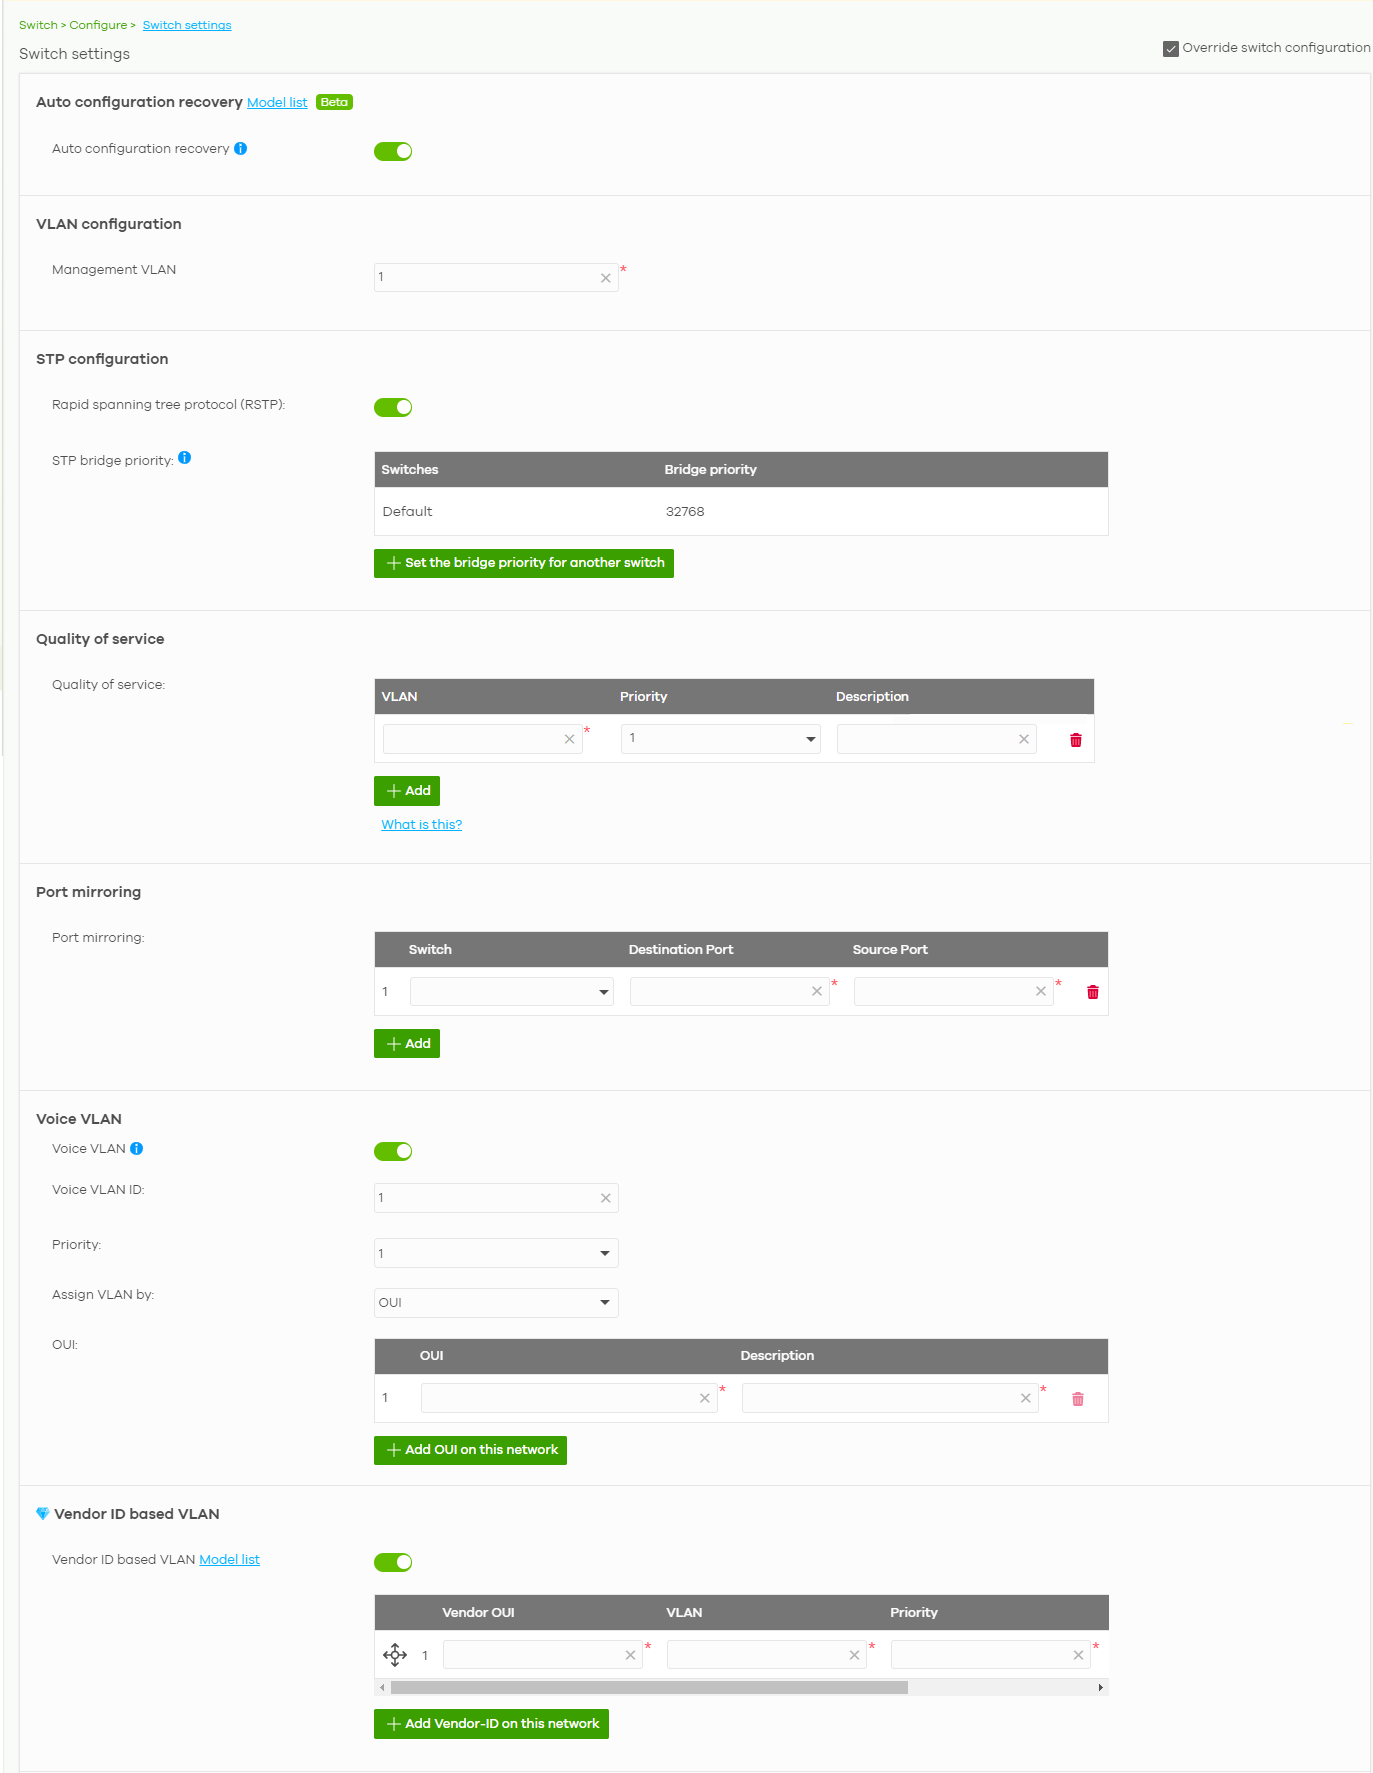
The following table describes the labels in this screen.
Label | Description |
|---|---|
Auto configuration recovery | |
Auto configuration recovery | When On, connectivity check to NCC is done 5 minutes after any configuration change. If an NCC connection problem is detected, the Nebula Device will return to its last saved custom default configuration. The Nebula Device will be locked by NCC and the banner N Switches are currently protected by Auto Configuration Recovery will be displayed. Otherwise, the latest configuration will be saved as the new custom default configuration. |
VLAN configuration | |
Management VLAN | Enter the VLAN identification number associated with the Nebula Device IP address. This is the VLAN ID of the CPU and is used for management only. The default is "1". All ports, by default, are fixed members of this "management VLAN" in order to manage the device from any port. If a port is not a member of this VLAN, then users on that port cannot access the device. To access the Nebula Device make sure the port that you are connected to is a member of Management VLAN. |
STP configuration | |
Rapid spanning tree protocol (RSTP) | Select On to enable RSTP on the Nebula Device. Otherwise, select Off. |
STP bridge priority | Bridge priority is used in determining the root Nebula Device, root port and designated port. The Nebula Device with the highest priority (lowest numeric value) becomes the STP root Nebula Device. If all Nebula Devices have the same priority, the Nebula Device with the lowest MAC address will then become the root Nebula Device. The lower the numeric value you assign, the higher the priority for this bridge. Click the button to create a new entry. Select the Nebula Devices for which you want to configure the bridge priority, and select a value from the drop-down list box. |
Quality of service | |
Quality of service | Enter a VLAN ID and select the priority level that the Nebula Device assigns to frames belonging to this VLAN. Enter a descriptive name for the QoS (Quality of Service). Click Add to create a new entry. |
Port mirroring | |
Port mirroring | Click Add to create a new entry. Select the Nebula Device for which you want to configure port mirroring, specify the destination port you copy the traffic to in order to examine it in more detail without interfering with the traffic flow on the original ports, and also enter the source port on which you mirror the traffic. |
Voice VLAN | |
Voice VLAN | Select On to enable the Voice VLAN feature on the Nebula Device. Otherwise, select Off. It groups the voice traffic with defined priority into an assigned VLAN which enables the separation of voice and data traffic coming into the Nebula Device port. |
Voice VLAN ID | Enter a VLAN ID number. |
Priority | Select the priority level of the Voice VLAN from 1 to 6. |
Assign VLAN by | Select how the Nebula Device assigns ports connected to VoIP devices to the Voice VLAN. OUI (Organizationally Unique Identifier): The Nebula Device assigns a port connected to a VoIP device to the Voice VLAN if the connected device’s OUI matches any OUI in the list. LLDP-MED: The Nebula Device assigns a port connected to a VoIP device to the voice VLAN if the connected device is identified as a VoIP device using the LLDP-MED protocol. |
OUI | Click Add OUI on this network to add an OUI and a description for the OUI. An Organizationally Unique Identifier identifies a manufacturer. Typically, a device’s OUI is the first three octets of the device’s MAC address. For example, if you have an IP phone from Company A with MAC address 00:0a:95:9d:68:16, you can enter OUI 00:0a:95 to match all devices from Company A. |
DSCP | Enter the Differentiated Services Code Point (DSCP) value for traffic on the voice VLAN. The value is defined from 0 through 63, and 0 is the default. |
Vendor ID based VLAN | |
Vendor ID based VLAN | Select On to enable the Vendor ID based VLAN feature on the Nebula Device. Otherwise, select Off. Click the Add Vendor-ID on this network button to define the vendor MAC address OUI, assign to which VLAN, and set the priority. Enter a descriptive name for the Vendor ID based VLAN. Enter up to 64 characters for this field including special characters inside the square quotes [~!@#$%^&*()_+{}|:”<>–=[]\;’,/ ]. |
Access management | |
Access management | Select On to enable the access management feature on the Nebula Device. Otherwise, select Off. |
Allow IP range | Click the Add allow IP range button to set the connected devices’ starting and ending IP addresses that will be allowed to access the Nebula Devices through telnet, SSH, HTTP, HTTPS, and FTP. |
Management VLAN control | This allows the administrator to set the Nebula Device ports through which the device management VLAN traffic is allowed. For example, 1, 10–15, or ALL. By default, NCC allows the device management VLAN traffic through all ports (even if Allowed VLAN in the Switch > Configure > Switch port settings is restricted). This avoids the device disconnecting from NCC during configuration. |
DHCP Server Guard | |
DHCP Server Guard | Select On to enable the DHCP server guard feature on the Nebula Device in order to prevent illegal DHCP servers. Only the first DHCP server that assigned the Nebula Device IP address is allowed to assign IP addresses to devices in this management VLAN. Otherwise, select Off to disable it. |
IP source guard | |
IP source guard | Select On to enable IP source guard protection. IP source guard uses a binding table to distinguish between authorized and unauthorized DHCP and ARP packets in your network. When the client does not exist in the binding table, the client is unauthorized and traffic will be blocked. To successfully access the network: • Client with static IP address will need to be added to the Allowed client list • Client with dynamic IP address will need to get their IP address from an authorized DHCP server. |
Protected switch | This shows the Nebula Device(s). • Select On to enable IP source guard protection on the Nebula Device. Then click Save. • Click the edit icon to go to Switch > Configure > Switch ports to configure Protected ports (see Switch Ports for more information). • Click Run to display a pop-up window showing the current client table. • Select the DHCP-snooping or Block entries and click Transfer to add these to the allowed client list. Then click Save. |
Allowed client list | This allows the administrator to define a set of clients. Click Add client to define the IPv4 address, MAC address, and VLAN of the static client. A previous entry will be overwritten when you enter a duplicate MAC address and VLAN ID. Click Actions > Edit to modify the static client entry. Then click Update. The MAC address and VLAN ID will appear in red when you enter a duplicate entry. Click Actions > Delete to remove the static client entry. Click Save to activate the settings. |