Maintenance
What You Can Do in this Chapter
• The Diagnostics screen (Diagnostics) generates a file containing the Zyxel Device’s configuration and diagnostic information if you need to provide it to customer support during troubleshooting.
• The Diagnostics > Networks Tools screen (Network Tools) to ping an IP address or trace the route packets take to a host.
• The Log > View Log screen (View Log) displays the Zyxel Device’s current log messages when it is disconnected from the NCC.
Diagnostics
This screen provides an easy way for you to generate a file containing the Zyxel Device’s configuration and diagnostic information. You may need to generate this file and send it to customer support during troubleshooting. All categories of settings and shell script files stored on the Zyxel Device will be included in the diagnostic file.
Click Maintenance > Diagnostics to open this screen. Click Collect Now to have the Zyxel Device create a new diagnostic file.
Maintenance > Diagnostics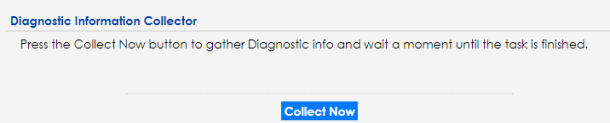
Network Tools
Use this screen to perform various network tests.
Click Maintenance > Diagnostics > Network Tools to open this screen.
Maintenance > Diagnostics > Network Tools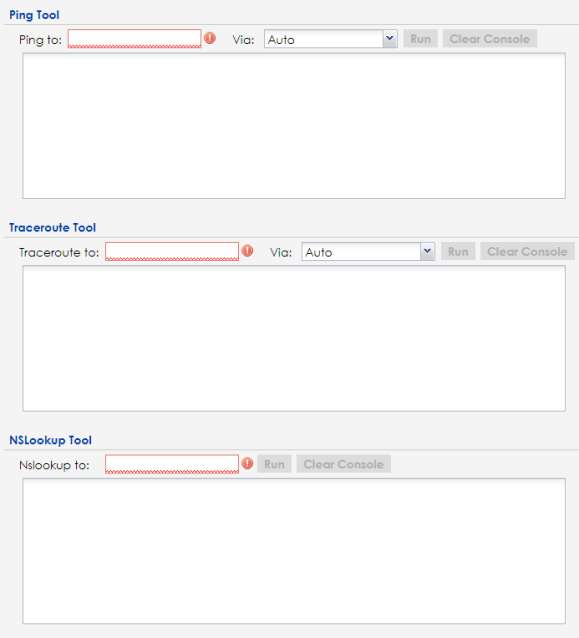
The following table describes the labels in this screen.
Label | Description |
|---|---|
Ping to | Enter the host name or IP address of a computer that you want to perform ping in order to test a connection. |
Via | Use the drop-down list to change the interface (Auto, wan, or lan) through which the Zyxel Device sends queries for ping. |
Traceroute to | Enter the host name or IP address of a computer that you want to perform the traceroute function. This determines the path a packet takes to the specified computer. |
Nslookup to | Enter a host name and click Run to resolve the IP address for the specified domain name. |
Run | Click this button to start the test. |
Clear Console | Click this button to clear data in the console. |
View Log
Log messages are stored in two separate logs, one for regular log messages and one for debugging messages. In the regular log, you can look at all the log messages by selecting All Logs, or you can select a specific category of log messages (for example, user). You can also look at the debugging log by selecting Debug Log. All debugging messages have the same priority.
Click Maintenance > Log > View Log to open this screen.
Events that generate an alert (as well as a log message) display in red. Regular logs display in black. Click a column’s heading cell to sort the table entries by that column’s criteria. Click the heading cell again to reverse the sort order.
The Web Configurator saves the filter settings once you click Search. If you leave the View Log screen and return to it later, the last filter settings would still apply.
Maintenance > Log > View Log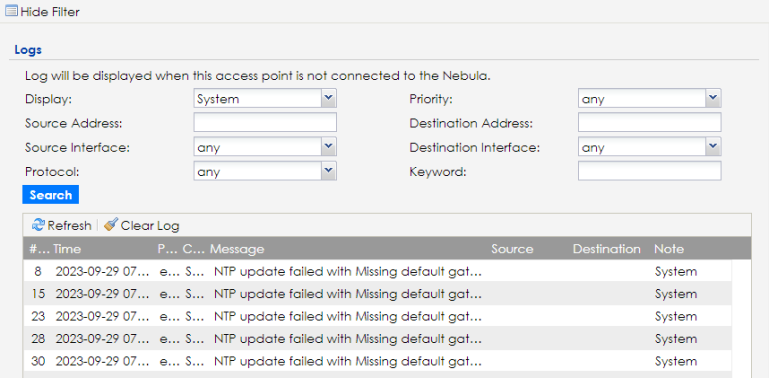
The following table describes the labels in this screen.
Label | Description |
|---|---|
Show Filter / Hide Filter | Click this button to show or hide the filter settings. The Priority, Source Address, Destination Address, Source Interface, Destination Interface, Protocol, Keyword, and Search fields are only available if the filter settings are shown. |
Display | Select the category of log message(s) you want to view. You can also view All Logs at one time, or you can view the Debug Log. |
Priority | This displays when you show the filter. Select the priority of log messages to display. The log displays the log messages with this priority or higher. Choices are: any, emerg, alert, crit, error, warn, notice, and info, from highest priority to lowest priority. This field is read-only if the Category is Debug Log. |
Source Address | This displays when you show the filter. Type the source IP address of the incoming packet that generated the log message. Do not include the port in this filter. |
Destination Address | This displays when you show the filter. Type the IP address of the destination of the incoming packet when the log message was generated. Do not include the port in this filter. |
Source Interface | This displays when you show the filter. Select the source interface of the packet that generated the log message. |
Destination Interface | This displays when you show the filter. Select the destination interface of the packet that generated the log message. |
Protocol | This displays when you show the filter. Select a service protocol whose log messages you would like to see. |
Keyword | This displays when you show the filter. Type a keyword to look for in the Message, Source, Destination and Note fields. If a match is found in any field, the log message is displayed. You can use up to 63 alphanumeric characters and the underscore, as well as punctuation marks ()’ ,:;?! +-*/= #$% @ ; the period, double quotes, and brackets are not allowed. |
Search | This displays when you show the filter. Click this button to update the log using the current filter settings. |
Refresh | Click this to update the list of logs. |
Clear Log | Click this button to clear the whole log, regardless of what is currently displayed on the screen. |
# | This field is a sequential value, and it is not associated with a specific log message. |
Time | This field displays the time the log message was recorded. |
Priority | This field displays the priority of the log message. It has the same range of values as the Priority field above. |
Category | This field displays the log that generated the log message. It is the same value used in the Display and (other) Category fields. |
Message | This field displays the reason the log message was generated. The text “[count=x]”, where x is a number, appears at the end of the Message field if log consolidation is turned on and multiple entries were aggregated to generate into this one. |
Source | This field displays the source IP address and the port number in the event that generated the log message. |
Source Interface | This field displays the source interface of the packet that generated the log message. |
Destination | This field displays the destination IP address and the port number of the event that generated the log message. |
Destination Interface | This field displays the destination interface of the packet that generated the log message. |
Protocol | This field displays the service protocol in the event that generated the log message. |
Note | This field displays any additional information about the log message. |