Summary Report
Use this screen to view statistics for the Nebula Devices and networks in the selected site.
Click Site-wide > Summary report to access this screen.
Site-wide > Summary report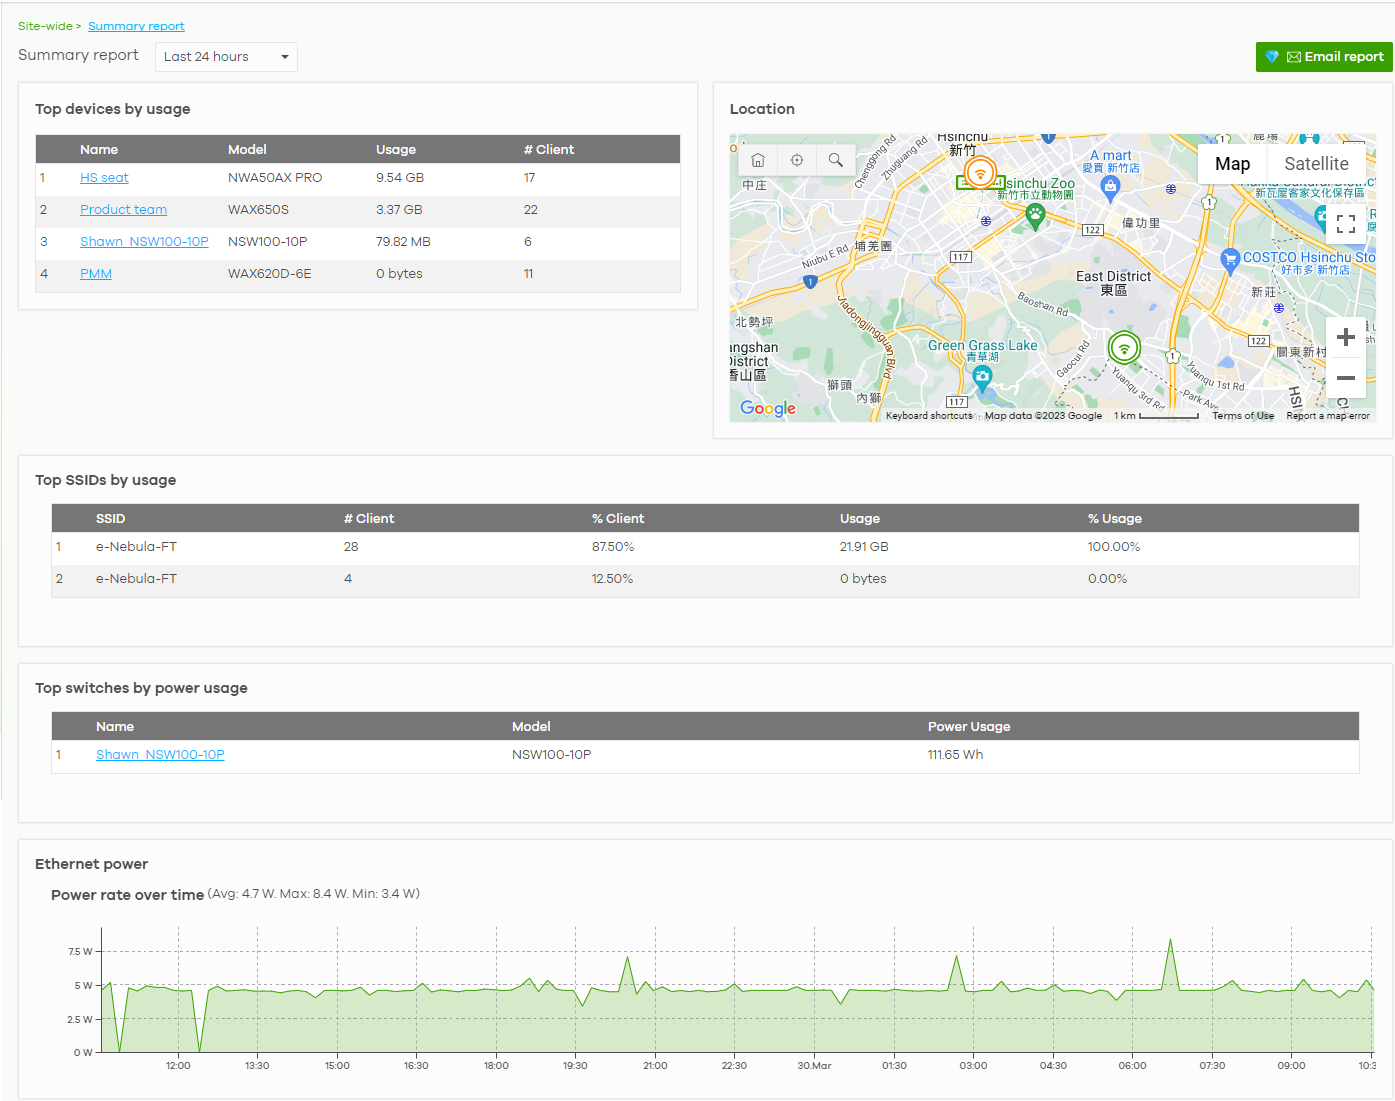
The following table describes the labels in this screen.
Label | Description |
|---|---|
Summary report | Select to view the report for the past day, week or month. Alternatively, select Custom range... to specify a time period the report will span. You can also select the number of results you want to view in a table.  |
Email report | Click this button to send summary reports by email, change the logo and set email schedules. |
Top devices by usage | |
This shows the index number of the Nebula Device. | |
Name | This shows the descriptive name of the Nebula Device. You can click the name to view the Nebula Device details. |
Model | This shows the model number of the Nebula Device. |
Usage | This shows the amount of data that has been transmitted by or through the Nebula Device. |
Client | This shows the number of clients currently connected to the Nebula Device. |
Location This shows the location of the site’s gateway device on the map. | |
Top SSIDs by usage | |
# | This shows the ranking of the SSID. |
SSID | This shows the SSID network name. |
Encryption | This shows the encryption method use by the SSID network. |
# Client | This shows how many WiFi clients are connecting to this SSID. |
% Client | This shows what percentage of associated WiFi clients are connecting to this SSID. |
Usage | This shows the total amount of data transmitted or received by clients connecting to this SSID. |
% Usage | This shows the percentage of usage for the clients connecting to this SSID. |
Top switches by power usage | |
# | This shows the ranking of the Nebula Switch. |
Name | This shows the descriptive name of the Nebula Switch. |
Model | This shows the model number of the Nebula Switch. |
Power Usage | This shows the total amount of power consumed by the Nebula Switch’s connected PoE devices during the specified period of time. |
Ethernet power | This graph shows power used by all PoE Switch ports in the site within the specified time, in Watts. |
Avg | This shows the average power consumption for all Switch ports. |
Max | This shows the maximum power consumption of the Switch ports. |
Min | This shows the minimum power consumption of the Switch ports. |
y-axis | The y-axis shows how much power is used by all Switches in the site, in Watts. |
x-axis | The x-axis shows the time period over which power consumption is recorded. |