Switch
Overview
This chapter discusses the menus that you can use to monitor the Nebula managed Switches in your network and configure settings even before a Nebula Device is deployed and added to the site.
Nebula Device refers to Zyxel Hybrid Switches (GS / XGS / XMG / XS Series) in this chapter. To view the list of Nebula Devices that can be managed through NCC, go to Help > Support tools > Device function table.
Monitor
Use the Monitor menus to check the Nebula Device information, client information, event log messages and summary report for Nebula Devices in the selected site.
Switches
This screen allows you to view the detailed information about a Nebula Device in the selected site. Click Switch > Monitor > Switches to access this screen.
Switch > Monitor > Switches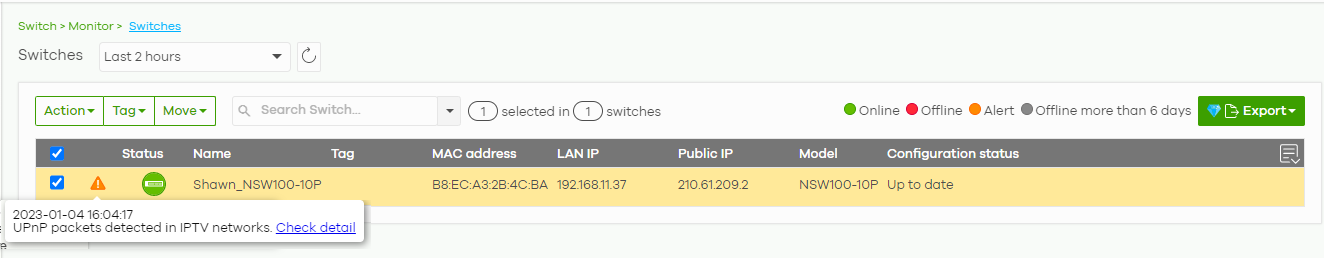
The following table describes the labels in this screen.
Label | Description |
|---|---|
Switch | Select to view the Nebula Device information and connection status in the past two hours, day, week or month. |
Click this button to reload the data-related frames on this page. | |
Action | Perform an action on the selected Nebula Devices. |
Reboot | Restart the Nebula Device. |
Upgrade | Upgrade the firmware on the Nebula Device. |
Tag | Select one or multiple Nebula Devices and click this button to create a new tag for the Nebula Devices or delete an existing tag. |
Move | Select one or multiple Nebula Devices and click this button to move the Nebula Device to another site or remove the Nebula Device from the current site. |
Search | Specify your desired filter criteria to filter the list of Nebula Devices. |
Switch | This shows the number of Nebula Devices connected to the site network. |
Export | Click this button to save the Nebula Device list as a CSV or XML file to your computer. |
Status | This shows the status of the Nebula Device. Hover the mouse over the icon for a brief description. • Green: The Nebula Device is online and has no alerts. • Amber: The Nebula Device has alerts. • Red: The Nebula Device is offline. • Gray: The Nebula Device has been offline for 7 days or more. • With lock: The Nebula Device is locked by Auto Configuration Recovery. See Switch > Configure > Switch settings for more information. Move the cursor over an amber alert icon to view the alerts the NCC generates when an error or something abnormal is detected on the IPTV network. |
Name | This shows the descriptive name of the Nebula Device. |
Tag | This shows the user-specified tag for the Nebula Device. |
MAC address | This shows the MAC address of the Nebula Device. |
LAN IP | This shows the local (LAN) IP address of the Nebula Device. |
Public IP | This shows the global (WAN) IP address of the Nebula Device. |
Model | This shows the model number of the Nebula Device. |
# Port | This shows the number of the Nebula Device port which is connected to the NCC. |
Configuration status | This shows whether the configuration on the Nebula Device is up-to-date. |
Bandwidth Utilization (Uplink port) | This shows what percentage of the upstream/downstream bandwidth is currently being used by the Nebula Device’s uplink port. |
Production information | This shows the Nebula Device’s product description to explain what this Nebula Device is and also provides information about its features. |
Connectivity | This shows the Nebula Device connection status. Nothing displays if the Nebula Device is offline. The gray time slot indicates the connection to the NCC is down, and the green time slot indicates the connection is up. Move the cursor over a time slot to see the actual date and time when a Nebula Device is connected or disconnected. |
Description | This shows the user-specified description for the Nebula Device. |
Serial number | This shows the serial number of the Nebula Device. |
Firmware status | This shows whether the firmware installed on the Nebula Device is up-to-date. |
Firmware type | This shows Stable when the installed firmware may not have the latest features but has passed Zyxel internal and external testing. This shows Latest when the installed firmware is the most recent release with the latest features, improvements, and bug fixes. This shows General Availability when the installed firmware is a release before Latest, but is still undergoing Zyxel external testing. This shows Dedicated when the installed firmware is locked and Zyxel support is monitoring. Contact Zyxel customer support if you want to unlock the firmware in order to upgrade to a later one. This shows Beta when the installed firmware is a release version for testing the latest features and is still undergoing Zyxel internal and external testing. This shows N/A when the Nebula Device is offline and its firmware status is not available. |
Firmware availability | This shows whether the firmware on the Nebula Device is Up to date, there is firmware update available for the Nebula Device (Upgrade available), or a specific version of firmware has been installed by Zyxel customer support (Locked). |
Current version | This shows the firmware version currently installed on the Nebula Device. |
Usage | This shows the amount of data that has been transmitted or received by the Nebula Device’s clients. |
IP type | This shows whether the IP address was assigned automatically (DHCP), or manually (Static IP). |
Click this icon to display a greater or lesser number of configuration fields. For faster loading of data, select only the configuration fields listed that do NOT take a long time to fetch data. |
Switch Details
Click a Nebula Device entry in the Switch > Monitor > Switches screen to display individual Nebula Device statistics.
Switch > Monitor > Switches: Switch Details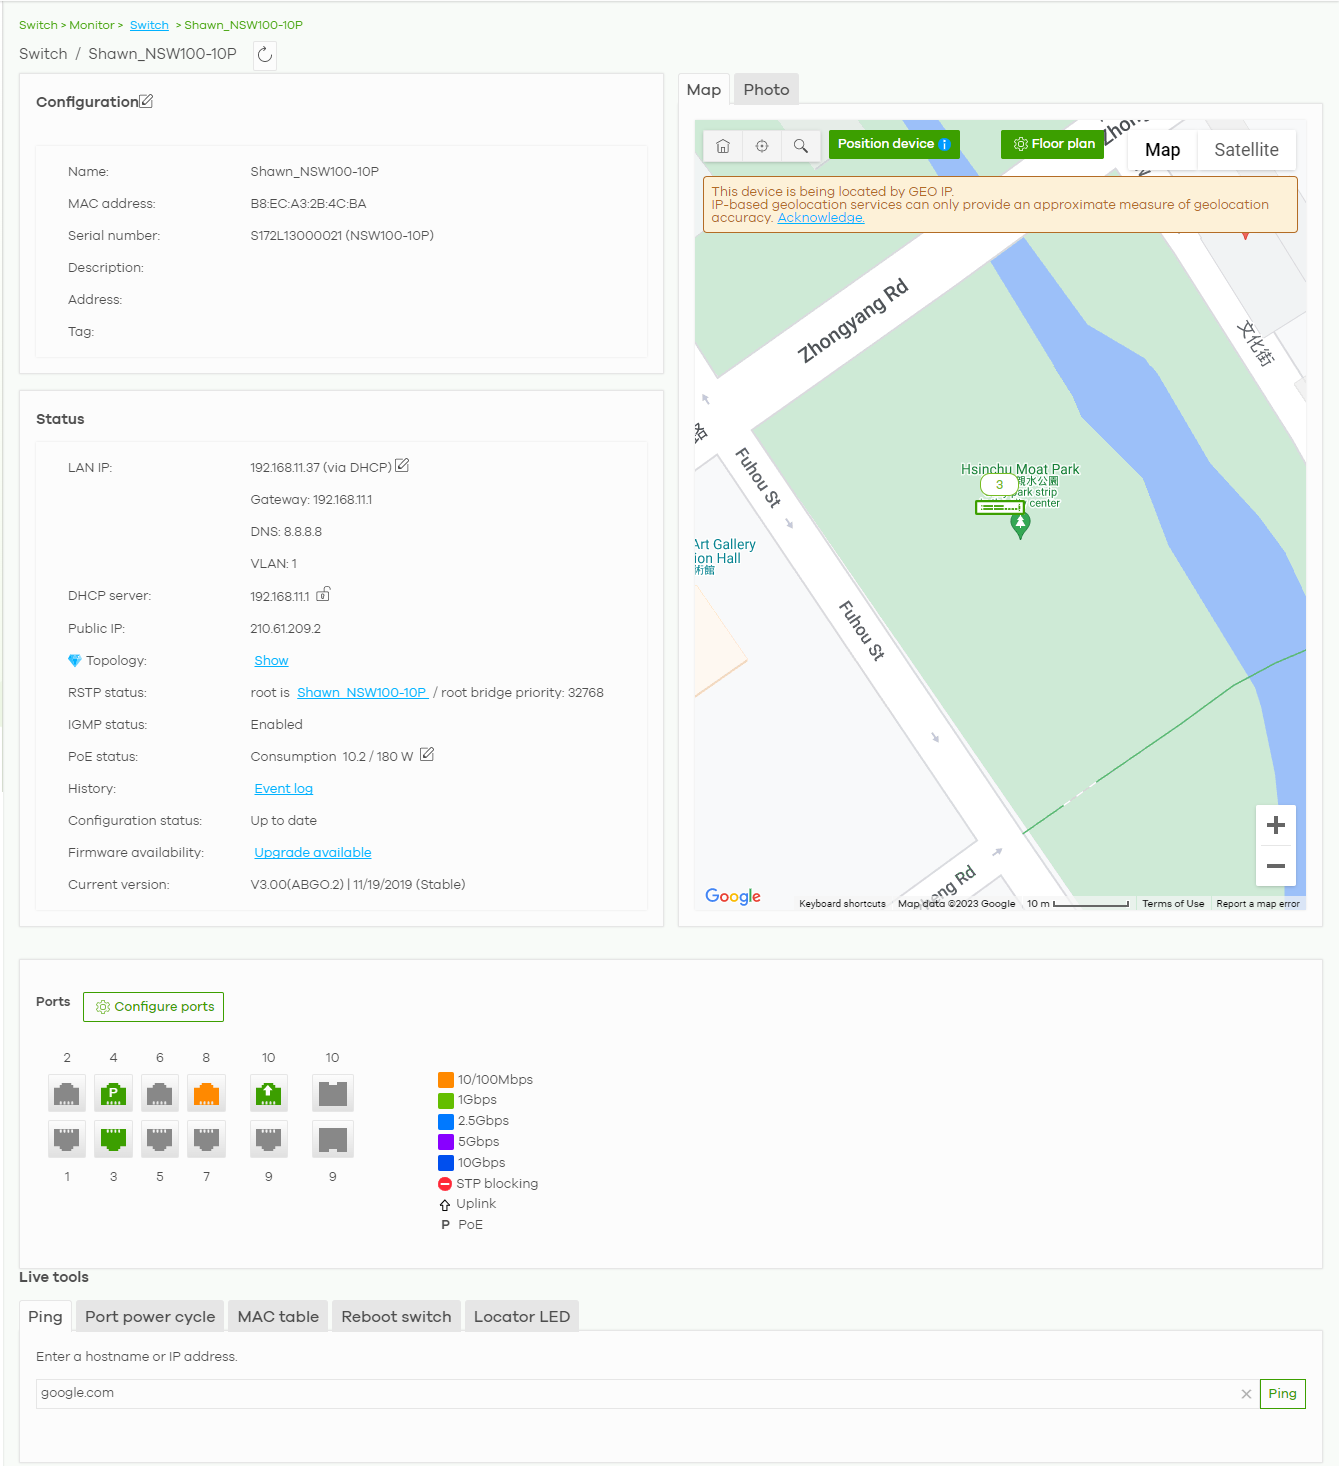
The following table describes the labels in this screen.
Label | Description |
|---|---|
Click this button to reload the data-related frames on this page. | |
Unlock | This button only appears when the Nebula Device is locked by NCC. Click this button to continue using the Nebula Device. |
Configuration Click the edit icon to change the Nebula Device name, description, tags and address. You can also move the Nebula Device to another site. After modifying a Nebula Device name, the new name will be synchronized to the Nebula Device and can be seen by protocols such as SNMP and LLDP. | |
Name | This shows the descriptive name of the Nebula Device. |
MAC address | This shows the MAC address of the Nebula Device. |
Serial number | This shows the serial number of the Nebula Device. |
Description | This shows the user-specified description for the Nebula Device. |
Address | This shows the user-specified address for the Nebula Device. |
Tag | This shows the user-specified tag for the Nebula Device. |
Status | |
LAN IP | This shows the local (LAN) IP address of the Nebula Device. It also shows the IP addresses of the gateway and DNS servers. Click the edit icon to open a screen where you can change the IP address, VLAN ID number and DNS server settings. |
DHCP server | This shows the IP address of the DHCP server. |
Public IP | This shows the global (WAN) IP address of the Nebula Device. |
Topology | |
RSTP status | This shows Disabled when RSTP is disabled on the Nebula Device. Otherwise, it shows the name or MAC address of the Nebula Device that is the root bridge of the spanning tree, and the bridge priority. |
IGMP status | This shows whether IGMP is enabled on the Nebula Device. If IGMP is enabled, it also shows the ID number of the VLAN on which the Nebula Device learns the multicast group membership and the IP address of the Nebula Device interface in IGMP querier mode. |
PoE status | This shows the power management mode, the amount of power the Nebula Device is currently supplying to the connected PoE-enabled devices and the total power the Nebula Device can provide to the connected PoE-enabled devices on the PoE ports. N/A displays if the Nebula Device does not support PoE. Click the edit icon to open the PoE Configuration screen. See PoE Configuration. |
History | Click Event log to go to the Switch > Monitor > Event log screen. |
Configuration status | This shows whether the configuration on the Nebula Device is up-to-date. |
Firmware availability | This shows whether the firmware on the Nebula Device is up-to-date or there is firmware update available for the Nebula Device. |
Current version | This shows the firmware version currently installed on the Nebula Device. |
Map | This shows the location of the Nebula Device on Google map (Map view or Satellite imagery view) or on a floor plan. Click Floor plan to display a list of existing floor plans. Each floor plan has a drawing that shows the rooms scaled and viewed from above. Drag-and-drop your Nebula Device directly on the Google map or click Position device to update the Nebula Device’s address (physical location). • Select GEO IP to use the public IP address of the Nebula Device. • Select Get my location from web browser to use the public IP address of the computer accessing the NCC portal. • Select Use the following address or coordinates to enter the complete address or coordinates of the Nebula Device. |
Photo | This shows the photo of the Nebula Device. Click Add to upload one or more photos. Click x to remove a photo. |
Ports This shows the ports on the Nebula Device. You can click a port to see the individual port statistics. See Switch Port Details. Move the pointer over a port to see additional port information. The port color indicates the connection status of the port. • Gray (#888888): The port is disconnected. • Orange (#FF8900): The port is connected and is transmitting data at 10 or 100 Mbps. • Green (#64BE00): The port is connected and is transmitting data at 1000 Mbps (1 Gbps). • Azure (#0079FF): The port is connected and is transmitting data at 2.5 Gbps. • Violet (#8800FF): The port is connected and is transmitting data at 5 Gbps. • Blue (#004FEE): The port is connected and is transmitting data at 10000 Mbps (10 Gbps). When the port is in the STP blocking state, failed LACP negotiation state, or failed port authentication state, a blocked icon displays on top of the port ( | |
Name | This shows the Nebula Device name configured in NCC. |
Status | This shows the connection status of the port. |
Type | This shows the port type (Trunk or Access), PVID, and allowed VLANs. |
Speed | This shows the current connection speed of the port. If the speed is unavailable, this displays “Ethernet”. |
LLDP | This shows the LLDP information received on the port. |
Reset | This button only appears when the PoE port is connected to a PD (powered device). Follow the prompt and click Confirm to reboot the PD connected to this port. |
Configure ports | Click this button to go to the Switch > Configure > Switch ports screen, where you can view port summary. See Switch Ports. |
Live tools | |
Ping | Enter the host name or IP address of a computer that you want to perform ping in order to test a connection and click Ping. |
Port Power Cycle | Enter the number of the ports and click the Reset button to disable and enable the ports again. |
MAC table | This shows what device MAC address, belonging to what VLAN group (if any) is forwarded to which ports. You can define how it displays and arrange the data in the summary table below. |
Switch tables | Import the following data into NCC: • MAC table. Click Run to show what device MAC address, belonging to what VLAN group (if any) is forwarded to which ports. You can define how it displays and arrange the data in the summary table. • Routing table. Click Run to show the routing destination, gateway, interface IP addresses, hop count, and routing methods. The routing table is only displayed for L3 Nebula Devices. • ARP table. Click Run to show the IP-to-MAC address mappings. The ARP table is only displayed for L3 Nebula Devices. • IP source guard. Click Run to show the static, DHCP snooping, blocked client entries, and expiration time of DHCP snooping and blocked entries on the Nebula Device. After clicking Run in IP source guard, the IPSG (IP source guard) table could be empty if: • It takes about 5 minutes to refresh the address table after you apply the Nebula Device settings • Protected port is not specified • NCC may not get completed data from Nebula Device due to unstable network. Please retry. |
Reboot switch | Click the Reboot button to restart the Nebula Device. |
Locator LED | Enter a time interval between 1 and 60 minutes to stop the locator LED from blinking. The locator LED will start to blink for the number of minutes set here. Click the  button to turn on the locator feature, which shows the actual location of the Nebula Device between several Nebula Devices in the network. button to turn on the locator feature, which shows the actual location of the Nebula Device between several Nebula Devices in the network. |
Remote Access | Select to use TCP (Transmission Control Protocol) Port 22 or 443 to establish a remote connection to this Nebula Device. The Nebula Device will create a reverse SSH (Secure SHell) connection. Then click Establish. After clicking Ok, NCC will provide a remote connection IPv4 address and service port number. For example, Remote connection: 34.247.173.104:27086. Use this IPv4 address and port to connect to the Nebula Device using an SSH terminal emulator (for example, Putty). The remote session will be available for 30 minutes. In case the connection cannot be established, confirm that the network allows Port 22 or 443. |
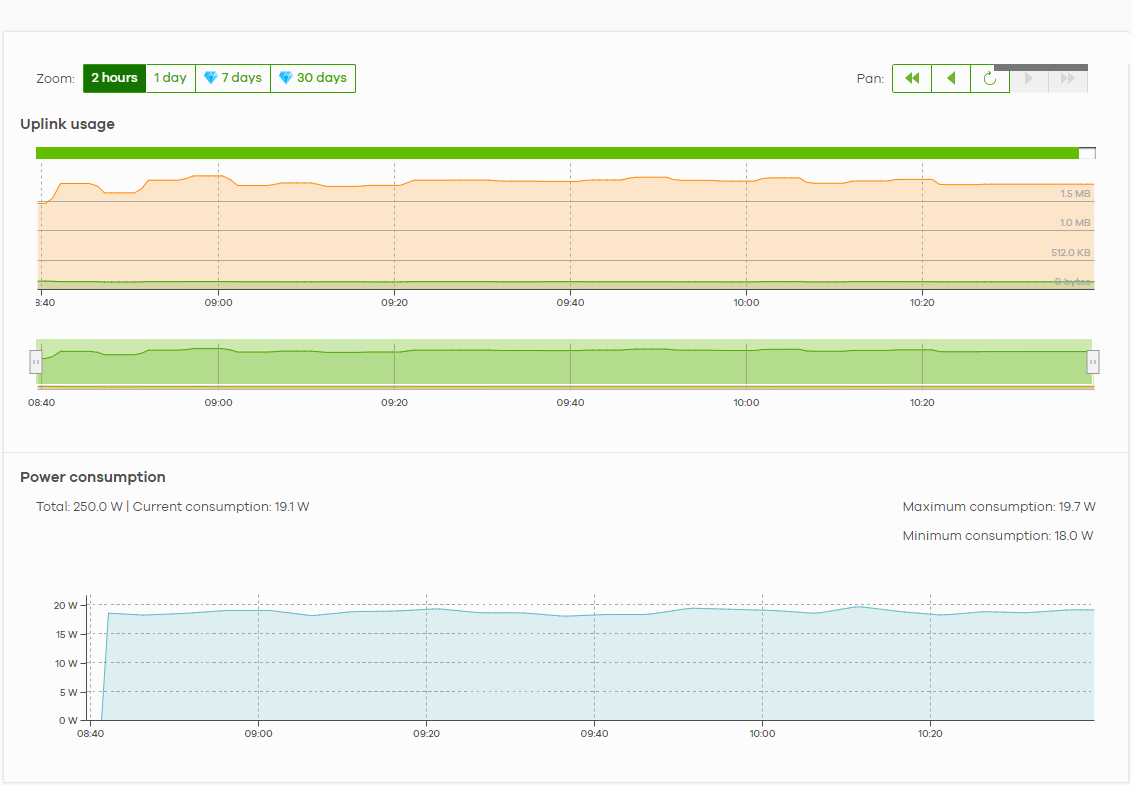
Uplink usage Move the cursor over the chart to see the transmission rate at a specific time. | |
Zoom | Select to view the statistics in the past 12 hours, day, week, month, 3 months or 6 months. |
Pan | Click to move backward or forward by one day or week. |
Power Consumption | |
Select to view the Nebula Device power consumption in the past two hours, day, week or month. | |
This shows the current, total, maximum and minimum power consumption of the Nebula Device. | |
y-axis | The y-axis shows how much power is used in Watts. |
x-axis | The x-axis shows the time period over which the power consumption is recorded. |
PoE Configuration
Use this screen to set the PoE settings for the Nebula Device. To access this screen, click the edit icon next to PoE Status in the Switch > Monitor > Switches: Switch Details screen.
Switch > Monitor > Switches: Switch Details: PoE Configuration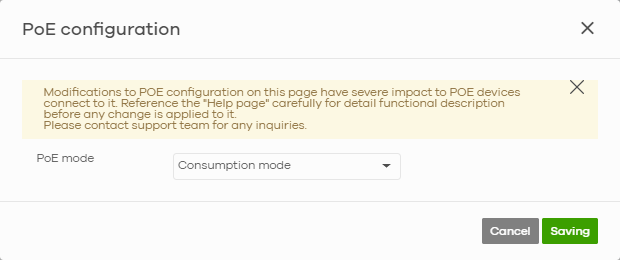
The following table describes the labels in this screen.
Label | Description |
|---|---|
PoE Mode | Select the power management mode you want the Nebula Device to use. Classification mode – Select this if you want the Nebula Device to reserve the Max Power (mW) to each powered device (PD) according to the priority level. If the total power supply runs out, PDs with lower priority do not get power to function. Consumption mode – Select this if you want the Nebula Device to manage the total power supply so that each connected PD gets a resource. However, the power allocated by the Nebula Device may be less than the Max Power (mW) of the PD. PDs with higher priority also get more power than those with lower priority levels. |
Close | Click this button to exit this screen without saving. |
Saving | Click this button to save your changes and close the screen. |
Switch Port Details
Use this to view individual Nebula Device port statistics. To access this screen, click a port in the Ports section of the Switch > Monitor > Switches: Switch Details screen or click the details link next to a port in the Switch > Configure > Switch ports screen.
Switch > Monitor > Switches: Switch Details: Port Details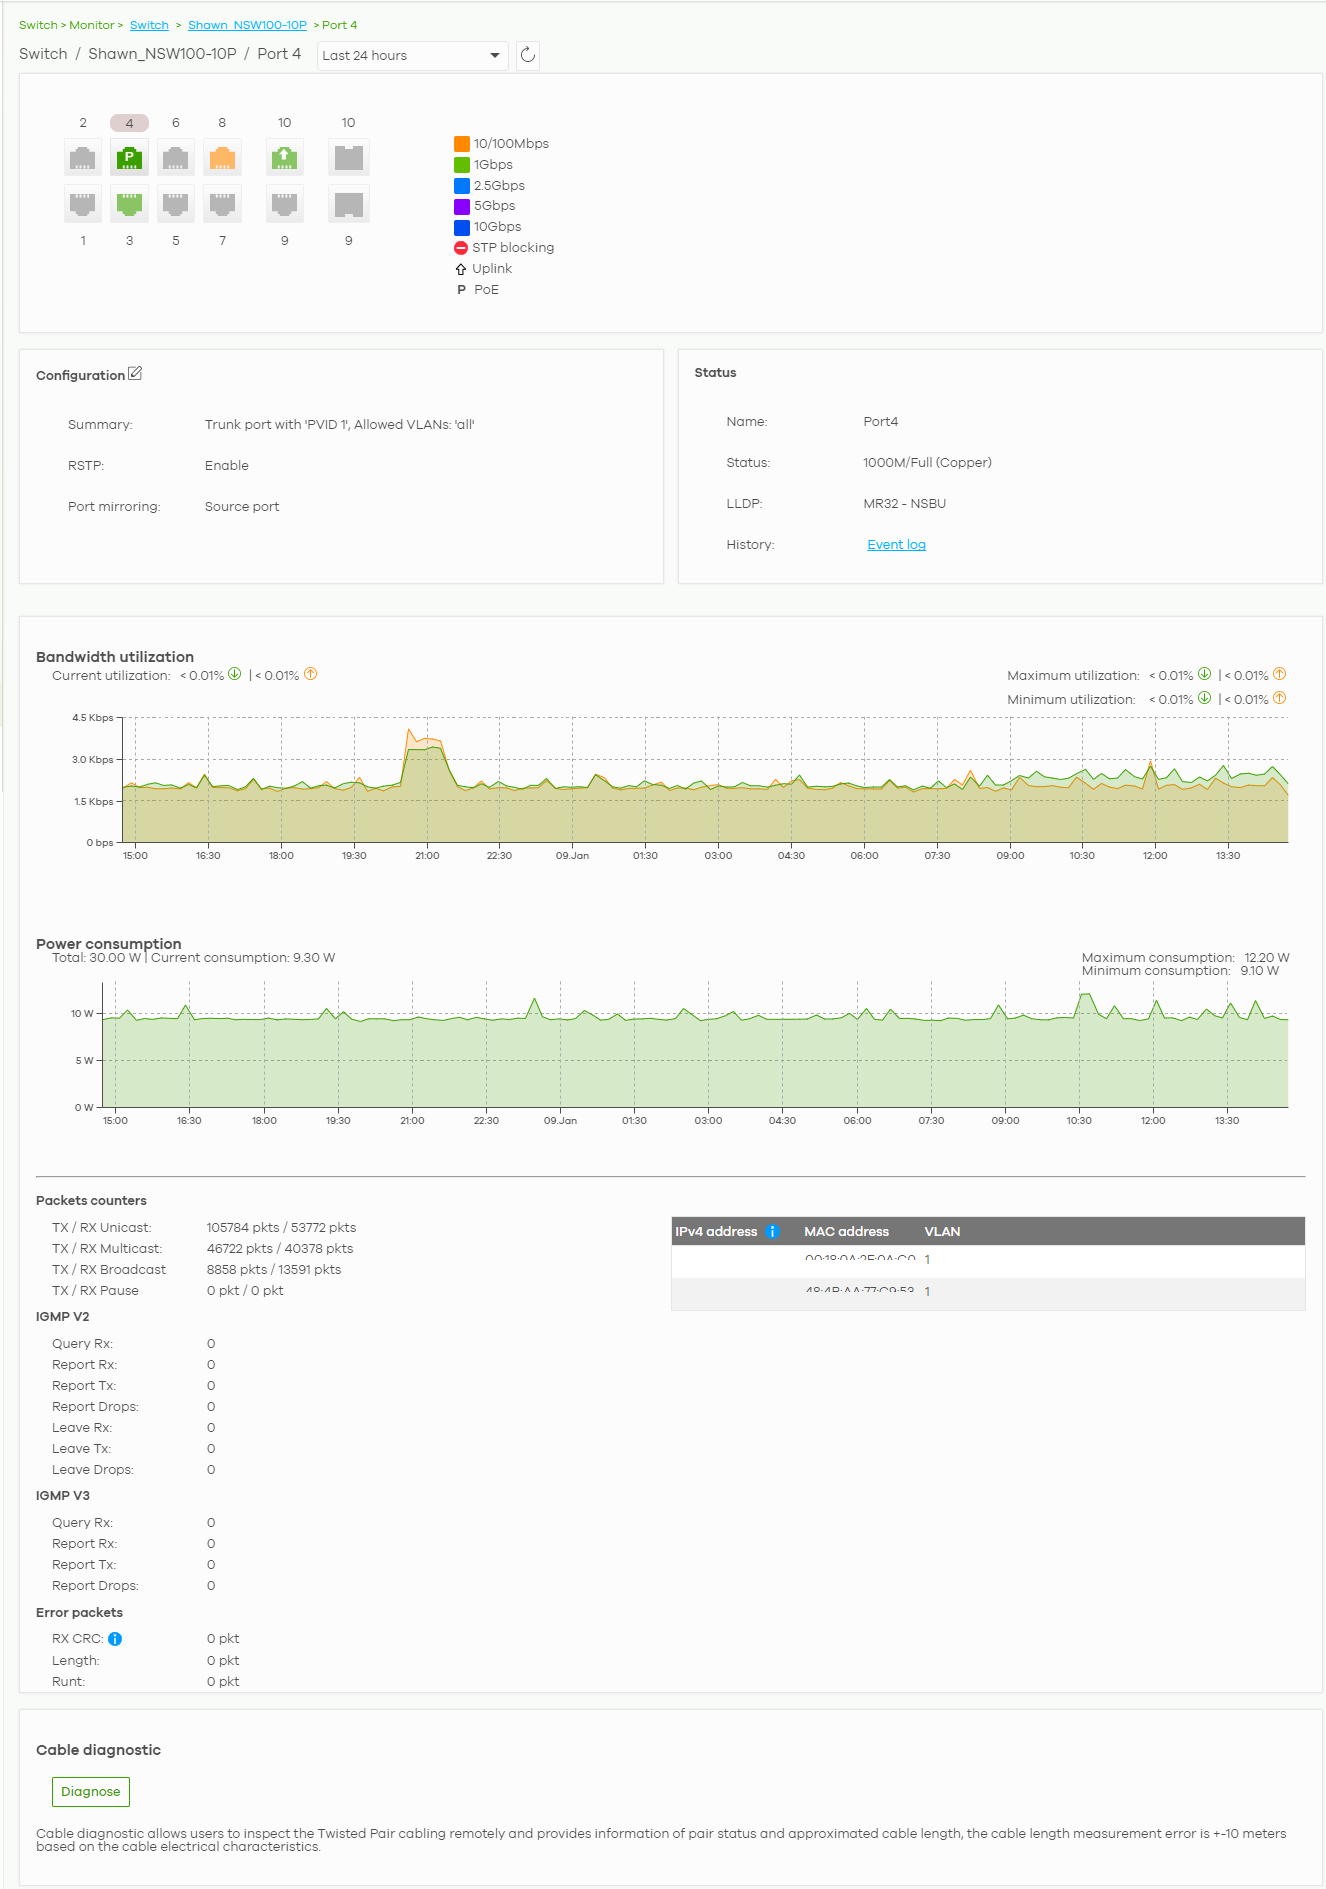
The following table describes the labels in this screen.
Label | Description |
|---|---|
Click this button to reload the data-related frames on this page. | |
Switch / Port | Select to view the port information and connection status in the past two hours, day, week or month. |
Port | This figure shows the ports on the Nebula Device. Click a port to go to the corresponding port details screen. The selected port is highlighted. Move the pointer over a port to see additional port information, such as its name, MAC address, type, and connection speed. The port color indicates the connection status of the port. • Gray (#888888): The port is disconnected. • Orange (#FF8900): The port is connected and is transmitting data at 10 or 100 Mbps. • Green (#64BE00): The port is connected and is transmitting data at 1000 Mbps (1 Gbps). • Azure (#0079FF): The port is connected and is transmitting data at 2.5 Gbps. • Violet (#8800FF): The port is connected and is transmitting data at 5 Gbps. • Blue (#004FEE): The port is connected and is transmitting data at 10000 Mbps (10 Gbps). When the port is in the STP blocking state, failed LACP negotiation state, or failed port authentication state, a blocked icon displays on top of the port ( |
Name | This shows the descriptive name of the port. |
Status | This shows the connection status of the port. |
MAC address | This shows the MAC address of the port. |
Type | This shows the port type (Trunk or Access), PVID, and allowed VLANs. |
Speed | This shows the current connection speed of the port. If the speed is unavailable, this displays “Ethernet”. |
LLDP | This shows the LLDP information received on the port. |
Configuration Click the edit icon to open the Switch ports screen and show the ports that match the filter criteria (the selected port number). See Switch Ports. | |
Summary | This shows the port’s VLAN settings. |
RSTP | This shows whether RSTP is disabled or enabled on the port. |
Port mirroring | This shows whether traffic is mirrored on the port. |
Status | |
Name | This shows the name of the port. |
Status | This shows the status of the port. |
LLDP | This shows the LLDP (Link Layer Discovery Protocol) information received on the port. |
History | Click Event log to go to the Switch > Monitor > Event log screen. |
Bandwidth Utilization | |
Current Utilization | This shows what percentage of the upstream/downstream bandwidth is currently being used by the port. |
Maximum Utilization | This shows the maximum upstream/downstream bandwidth utilization (in percentage). |
Minimum Utilization | This shows the minimum upstream/downstream bandwidth utilization (in percentage). |
y-axis | The y-axis represents the transmission rate in Kbps (kilobits per second). |
x-axis | The x-axis shows the time period over which the traffic flow occurred. |
Power Consumption | |
Total | This shows the total power consumption of the port. |
Current Consumption | This shows the current power consumption of the port. |
Maximum Consumption | This shows the maximum power consumption of the port. |
Minimum Consumption | This shows the minimum power consumption of the port. |
y-axis | The y-axis shows how much power is used in Watts. |
x-axis | The x-axis shows the time period over which the power consumption is recorded. |
Packets Counters | |
TX/RX Unicast | This shows the number of good unicast packets transmitted/received on the port. |
TX/RX Multicast | This shows the number of good multicast packets transmitted/received on the port. |
TX/RX Broadcast | This shows the number of good broadcast packets transmitted/received on the port. |
TX/RX Pause | This shows the number of 802.3x Pause packets transmitted/received on the port. |
IGMP V2/V3 | |
Query Rx | This shows the number of IGMP query packets received on the port. |
Report Rx | This shows the number of IGMP report packets received on the port. |
Report Tx | This shows the number of IGMP report packets transmitted on the port. |
Report Drops | This shows the number of IGMP report packets dropped on the port. |
Leave Rx | This shows the number of IGMP leave packets received on the port. |
Leave Tx | This shows the number of IGMP leave packets transmitted on the port. |
Leave Drops | This shows the number of IGMP leave packets dropped on the port. |
Error Packets | |
RX CRC | This shows the number of packets received with CRC (Cyclic Redundant Check) errors. CRC errors indicate packet errors in the network, potentially caused by mismatching Ethernet speed/duplex, bad cables or transceivers, or malfunctioning client devices. |
Length | This shows the number of packets received with a length that was out of range. |
Runt | This shows the number of packets received that were too short (shorter than 64 octets), including the ones with CRC errors. |
IPv4 Address | This shows the IP address of the incoming frame which is forwarded on the port. • LLDP remote information • Information collected by the Nebula Security Gateway (NSG) in this site • Information collected by NCC when the client connected to Nebula |
MAC Address | This shows the MAC address of the incoming frame which is forwarded on the port. |
VLAN | This shows the VLAN group to which the incoming frame belongs. |
Cable Diagnostics | |
Diagnose | Click Diagnose to perform a physical wire-pair test of the Ethernet connections on the port. The following fields display when you diagnose a port. |
Channel | An Ethernet cable usually has four pairs of wires. A 10BASE-T or 100BASE-TX port only use and test two pairs, while a 1000BASE-T port requires all four pairs. This displays the descriptive name of the wire-pair in the cable. |
Pair Status | OK: The physical connection between the wire-pair is okay. Open: There is no physical connection (an open circuit detected) between the wire-pair. Short: There is a short circuit detected between the wire-pair. Unknown: The Nebula Device failed to run cable diagnostics on the cable connected to this port. Unsupported: The port is a fiber port or it is not active. |
Cable Length | This displays the total length of the Ethernet cable that is connected to the port when the Pair Status is OK and the Nebula Device chipset supports this feature. This shows N/A if the Pair Status is Open or Short. Check the Distance to fault. This shows Unsupported if the Nebula Device chipset does not support to show the cable length. |
Distance to fault (m) | This displays the distance between the port and the location where the cable is open or shorted. This shows N/A if the Pair Status is OK. This shows Unsupported if the Nebula Device chipset does not support to show the distance. |
DDMI | This section is available only on an SFP (Small Form Factor Pluggable) port. |
DDMI | Click DDMI (Digital Diagnostics Monitoring Interface) to display real-time SFP transceiver information and operating parameters on the port. You can also see the alarm and warning thresholds for temperature, voltage, transmission bias, transmission and receiving power. |
Port | This shows the number of the port on the Nebula Device. |
Vendor | This shows the vendor name of the transceiver installed in the port. |
PN | This shows the part number of the transceiver installed in the port. |
SN | This shows the serial number of the transceiver installed in the port. |
Revision | This shows the firmware version of the transceiver installed in the port. |
Date-code | This shows the date the installed transceiver’s firmware was created. |
Transceiver | This shows the type and the Gigabit Ethernet standard supported by the transceiver installed in the port. |
Calibration | This shows whether the diagnostic information is internally calibrated or externally calibrated. |
Current | This shows the current operating parameters on the port, such as transceiver temperature, laser bias current, transmitted optical power, received optical power and transceiver supply voltage. |
High Alarm Threshold | This shows the high alarm threshold for temperature, voltage, transmission bias, transmission and receiving power. A trap is sent when the operating parameter is above the threshold. |
High Warn Threshold | This shows the high warning threshold for temperature, voltage, transmission bias, transmission and receiving power. |
Low Warn Threshold | This shows the low alarm threshold for temperature, voltage, transmission bias, transmission and receiving power. A trap is sent when the operating parameter is below the threshold. |
Low Alarm Threshold | This shows the low warning threshold for temperature, voltage, transmission bias, transmission and receiving power. |