Switch
Overview
This chapter discusses the menus that you can use to monitor the Nebula managed Switches in your network and configure settings even before a Nebula Device is deployed and added to the site.
Nebula Device refers to Zyxel Hybrid Switches (GS / XGS / XMG / XS Series) in this chapter. To view the list of Nebula Devices that can be managed through NCC, go to Help > Support tools > Device function table.
Monitor
Use the Monitor menus to check the Nebula Device information, client information, event log messages and summary report for Nebula Devices in the selected site.
Event Log
Use this screen to view Nebula Device log messages. You can enter the Nebula Device name or a key word, select one or multiple event types, or specify a date/time or even a time range to display only the log messages related to it.
Click Site-wide > Monitor > Switches > Event log to access this screen.
Site-wide > Monitor > Switches > Event log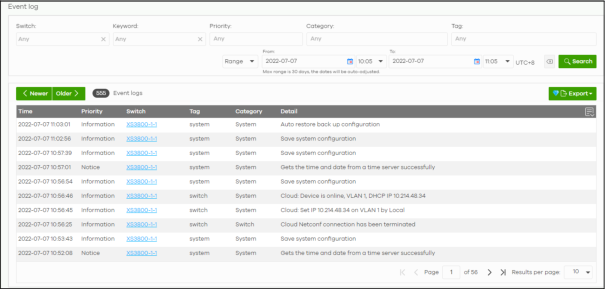

Surveillance
Use this screen to view information about Powered Devices (PDs) connected to ports on the Nebula Device.
Click Site-wide > Monitor > Switches > Surveillance to access this screen.
Site-wide > Monitor > Switches > Surveillance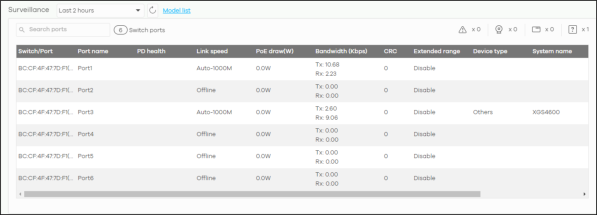

The following table describes the labels in this screen.
Label | Description |
|---|---|
Search ports | Enter a keyword to filter the list of ports or devices. |
N switch ports | This shows the number of Nebula Device ports (N) in the list. |
This shows the number of connected PDs that did not respond to an automatic PD alive check. | |
This shows the number of ONVIF-compatible IP camera devices connected to Nebula Devices in the site. | |
This shows the number of ONVIF-compatible NVR devices connected to Nebula Devices in the site. | |
This shows the number of connected devices that did not respond to an ONVIF discovery query, or are of an unknown type. | |
Switch/Port | This shows the port number of the Nebula Device. |
Port name | This shows the port description on the Nebula Device. |
PD health | This shows the status of auto PD recovery on this port. • Red: The Nebula Device failed to get information from the PD connected to the port using LLDP, or the connected PD did not respond to the Nebula Device’s ping requests. • Yellow: The Nebula Device is restarting the connected PD by turning the power off and turning it on again. • Green: The Nebula Device successfully discovered the connected PD using LLDP or ping. • --: Auto PD Recovery is not enabled on the Nebula Device and/or the port, or the switch is not supplying power to the connected PD. |
Link speed | This shows the speed (either 10M for 10 Mbps, 100M for 100 Mbps, or 1G for 1 Gbps) and the duplex (F for full duplex or H for half). This field displays Down if the port is not connected to any device. |
PoE draw(W) | This shows the total power that the connected PD draws from the port, in watts. This allows you to plan and use within the power budget of the Nebula Device. |
Bandwidth (Kbps) | Tx shows the number of kilobytes per second transmitted on this port. Rx shows the number of kilobytes per second received on this port. |
CRC | This shows the number of packets received with CRC (Cyclic Redundant Check) errors. |
Extended range | This shows whether extended range is enabled on the port. |
Device type | This shows the device type of the PD, as reported by ONVIF discovery. |
System name | This shows the name of the connected PD, as reported by ONVIF or LLDP. |
IP | This shows the IP address of the connected PD, as reported by ONVIF or LLDP. |
Discovered devices | This shows how many devices are connected to the port. Click the number to go to the Surveillance Port Details screen. |
Surveillance Port Details
Use this screen to view detailed information about a port on the Surveillance screen.
Go to Site-wide > Monitor > Switches > Surveillance and click on a value in the Discovered Devices column to access this screen.
Site-wide > Monitor > Switches > Surveillance > Port Details

The following table describes the labels in this screen.
Label | Description |
|---|---|
Status | |
Link speed | This shows the speed (either 10M for 10 Mbps, 100M for 100 Mbps, or 1G for 1 Gbps) and the duplex (F for full duplex or H for half). This field displays Down if the port is not connected to any device. |
PoE draw | This shows the total power that the connected PD draws from the port, in watts. This allows you to plan and use within the power budget of the Nebula Device. |
PD health | This shows the status of auto PD recovery on this port. • Red: The Nebula Device failed to get information from the PD connected to the port using LLDP, or the connected PD did not respond to the Nebula Device’s ping requests. • Yellow: The Nebula Device is restarting the connected PD by turning the power off and turning it on again. • Green: The Nebula Device successfully discovered the connected PD using LLDP or ping. • --: Auto PD Recovery is not enabled on the Nebula Device and/or the port, or the Nebula Device is not supplying power to the connected PD. For details on configuring auto PD recovery on a port, see Switch Ports. |
Extended range | This shows whether extended range is enabled on the port. |
Bandwidth Tx/Rx (%) | Tx shows the number of kilobytes per second transmitted on this port. Rx shows the number of kilobytes per second received on this port. |
CRC | This shows the number of packets received with CRC (Cyclic Redundant Check) errors. |
Power cycle | Click Reset to power off the PD connected to the port, by temporarily disabling then re-enabling PoE. |
Neighbor detail | This section shows all clients connected to the port. |
Search clients | Search for one or more clients in the list by keyword, status, system name, port, IP address, or firmware version. |
clients | This shows the number of clients connected to this port. |
Flush | Click this to remove all offline clients from the list. |
Status | This shows whether the client is online (green) or offline (red), and whether the client is wired or wireless. |
System name | This displays the system name of the Nebula Device. |
Port | This displays the number of the Nebula Device port that is connected to the Nebula Device. |
IP | This shows the IP address of the Nebula Device. |
Firmware | This shows the firmware version currently installed on the Nebula Device. |
Description | This shows the descriptive name of the Nebula Device. |
IPTV Report
Use this screen to view available IPTV channels and client information.
Click Site-wide > Monitor > Switches > IPTV report to access this screen.
Site-wide > Monitor > Switches > IPTV Report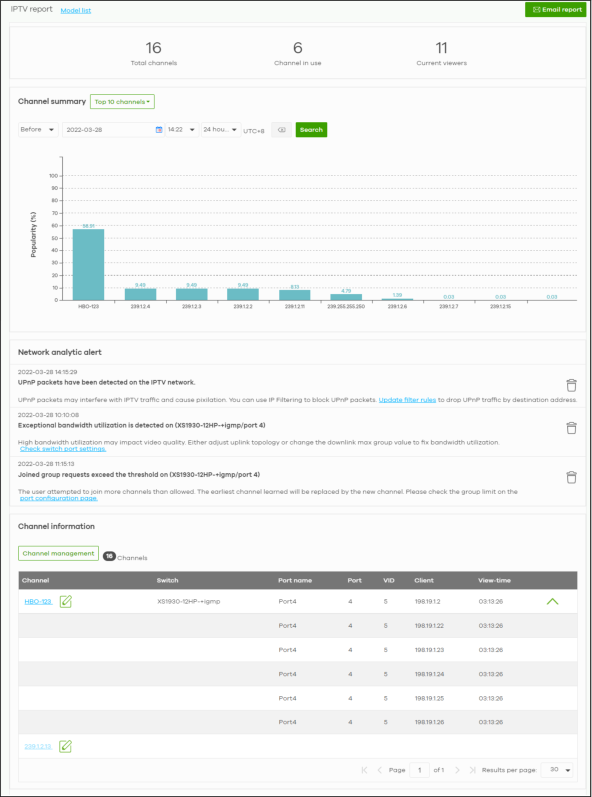

The following table describes the labels in this screen.
Label | Description |
|---|---|
IPTV report | Click Model list to show the Non-supported model list. Click See more to go to the Help > Support tools > Device function table screen. |
Email report | Click this button to send channel summary report by email, change the report logo and set email schedules. |
Total channels | This shows the total number of IPTV channels that match the search criteria. |
Channel in use | This shows the number of channels that are being watched by IPTV clients. |
Current viewers | This shows the number of clients who are watching the IPTV channels. |
Channel Summary | |
Select to view the channels according to the ranking. Alternatively, select Select channels to choose specific channels and click Apply.  | |
Search | Specify a date/time and select to view the channels available in the past day, week or month before the specified date/time after you click Search. You can also select Range in the second field, set a time range and click Search to display only the channels available within the specified period of time. |
y-axis | The y-axis represents the Popularity (%) of IPTV channels. |
x-axis | The x-axis shows the name of the IPTV channel. It shows the channel’s multicast group address by default. |
Network Analytic Alert | This shows the alerts the NCC generates when an error or something abnormal is detected on the IPTV network. For example, the maximum number of the IGMP multicast groups (TV channels) a Nebula Device port can join is reached and new groups replace the earliest ones, UPnP packets are detected on the IPTV network and may interfere with IPTV traffic to cause TV pixelation, or high bandwidth usage on a certain Nebula Device port results in loss of video quality. |
Channel Information | |
Channel Management | Download the channel list and import multiple records for faster channel naming. Click Add to add new channels. 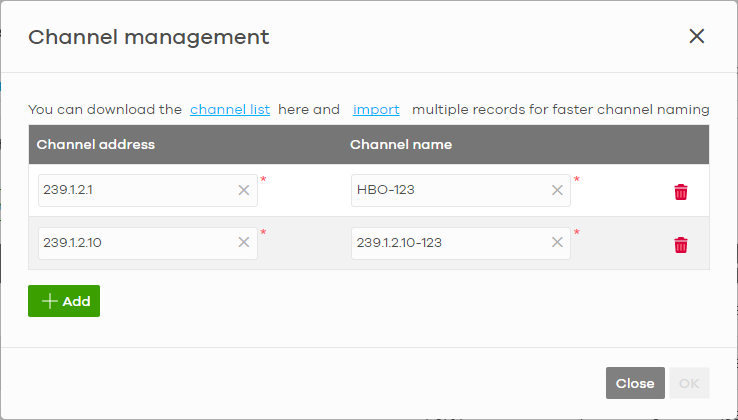 |
Channel | This shows the name of the channel. Click the edit icon to change the channel name. Click the channel name to display the channel’s client statistics. See Channel Information. |
Switch | This shows the name of the Nebula Device to which the client is connected. |
Port Name | This shows the name of the Nebula Device port to which the client is connected. |
Port | This shows the number of the Nebula Device port to which the client is connected. |
VID | This shows the ID number of the VLAN to which the Nebula Device port belongs. |
Client | This shows the IP address of the client who is watching the TV program on the channel. |
View-time | This shows the amount of time the client has spent watching the IPTV channel. |
Email Report
Use this screen to configure the email recipient’s address, change the logo and set email schedules. To access this screen, click the Email report button in the Site-wide > Monitor > Switches > IPTV Report screen.
Site-wide > Monitor > Switches > IPTV Report: Email report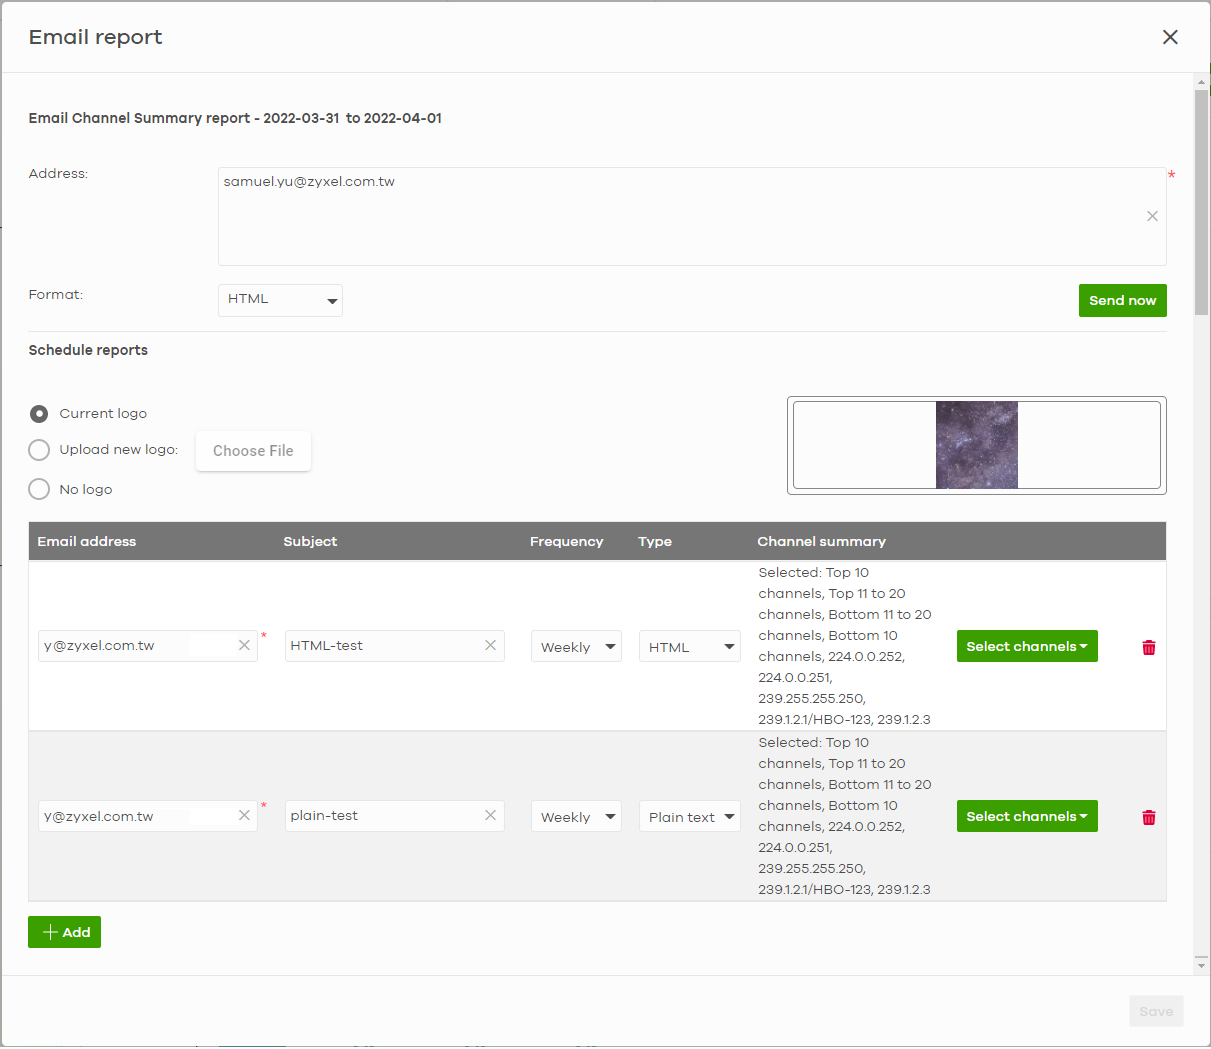

The following table describes the labels in this screen.
Label | Description |
|---|---|
Email Channel Summary report | This shows the range of the date/time you specified in the Site-wide > Monitor > Switches > IPTV Report screen. |
Address | Enter the recipient’s email address of the IPTV channel summary report. |
Format | Select to send the IPTV channel summary report in HTML or Plain text format. |
Send now | Click this button to send the IPTV channel summary report now. |
Schedule reports | |
logo | This shows the logo image that you uploaded for the customized IPTV channel summary report. Select Current logo to continue using the present logo. Select Upload new logo and click Choose File to locate the logo graphic. You can use the following image file formats: GIF, PNG, or JPG. File size must be less than 200 KB, and images larger than 244 x 190 will be resized. Select No logo if you do not want a logo to appear on the IPTV channel summary report. |
+ Add | Click this button to add a scheduled IPTV channel summary report profile. |
Email address | Enter the recipient’s email address of the IPTV channel summary report. |
Subject | Enter the subject of the IPTV channel summary report. |
Frequency | Select to send the IPTV channel summary report Monthly, Weekly, or Daily. |
Type | Select to send the IPTV channel summary report in HTML or Plain text format. |
Channel summary | |
Select to view the channels report according to the ranking. Alternatively, select Select channels to choose specific channels and click Update.  | |
Remove | Click this to delete a scheduled profile. |
Save | Click Save to save the new scheduled profile. |
Channel Information
Use this screen to view the IPTV channel’s client information and statistics. To access this screen, click a channel name from the Channel Information list in the Site-wide > Monitor > Switches > IPTV Report screen.
Site-wide > Monitor > Switches > IPTV Report: Channel Information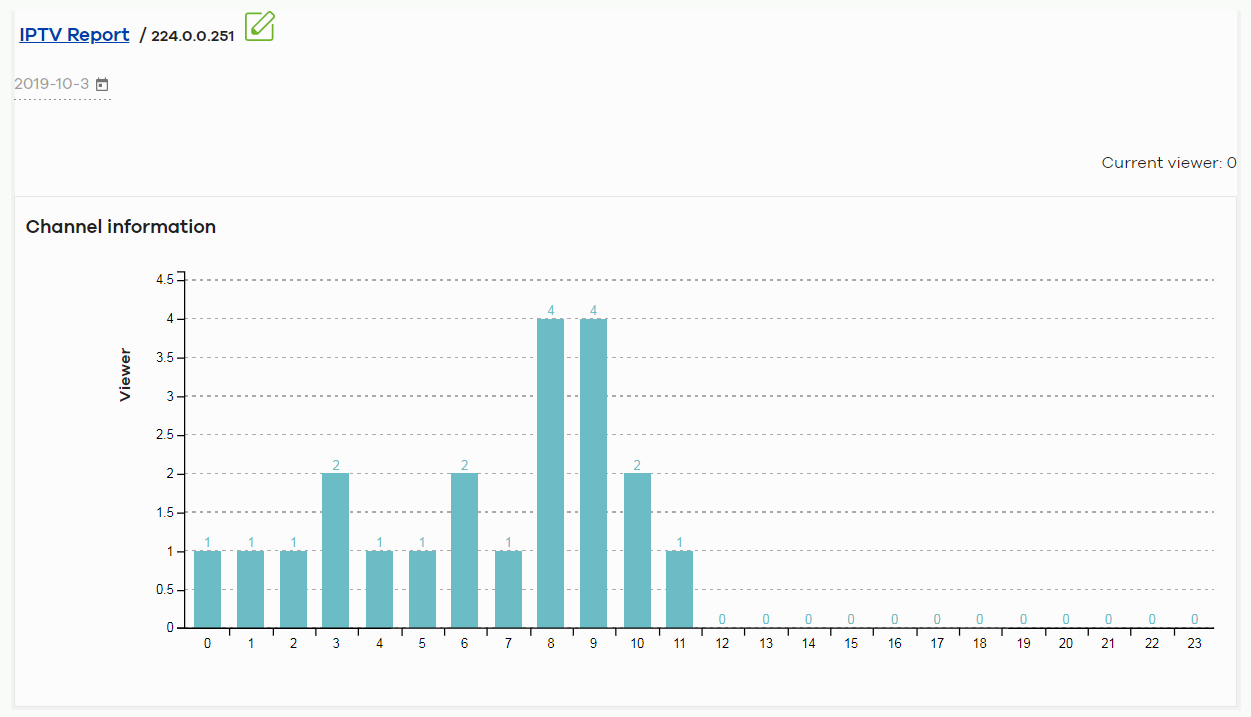

The following table describes the labels in this screen.
Label | Description |
|---|---|
Select a specific date to display only the clients who watch the IPTV channel on that day. | |
Current Viewer | This shows the number of clients who are currently watching the IPTV channel. |
y-axis | The y-axis shows the number of clients watching the IPTV channel. |
x-axis | The x-axis shows the hour of the day in 24-hour format. |
Switch | This shows the name of the Nebula Device to which the client is connected. |
Port Name | This shows the name of the Nebula Device port to which the client is connected. |
Port | This shows the number of the Nebula Device port to which the client is connected. |
VID | This shows the ID number of the VLAN to which the Nebula Device port belongs. |
Client | This shows the IP address of the client who is watching the TV program on the channel. |
View-time | This shows the amount of time the client has spent watching the IPTV channel. |
Summary Report
This screen displays network statistics for Nebula Devices of the selected site, such as bandwidth usage, top ports and/or top Nebula Devices.
Click Site-wide > Monitor > Switches > Summary Report to access this screen.
Site-wide > Monitor > Switches > Summary Report

The following table describes the labels in this screen.
Label | Description |
|---|---|
Switch – Summary report | Select to view the report for the past day, week or month. Alternatively, select Custom range... to specify a time period the report will span. You can also select the number of results you want to view in a table. 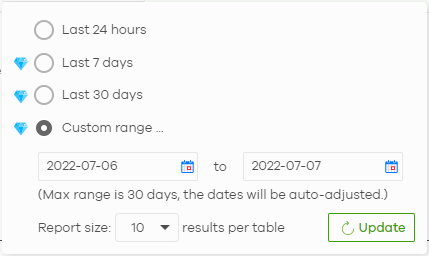 |
Email report | Click this button to send summary reports by email, change the logo and set email schedules. |
Consumption | |
Total | This shows the total power consumption of the Nebula Device ports. |
Current Consumption | This shows the current power consumption of the Nebula Device ports. |
Max Consumption | This shows the maximum power consumption of the Nebula Device ports. |
Min Consumption | This shows the minimum power consumption of the Nebula Device ports. |
y-axis | The y-axis shows how much power is used in Watts. |
x-axis | The x-axis shows the time period over which the power consumption is recorded. |
Top power consumption | |
# | This shows the ranking of the Nebula Device. |
Name | This shows the descriptive name of the Nebula Device. |
Model | This shows the model number of the Nebula Device. |
Power Usage | This shows the total amount of power consumed by the Nebula Device’s connected PoE devices during the specified period of time. |
Peak Power | |
# | This shows the ranking of the Nebula Device. |
Name | This shows the descriptive name of the Nebula Device. |
Model | This shows the model number of the Nebula Device. |
Max Power | This shows the maximum power consumption for the Nebula Device’s connected PoE devices during the specified period of time. |
Power % | This shows what percentage of the Nebula Device’s total power budget has been consumed by connected PoE powered devices. |
Top uplink port | |
# | This shows the ranking of the Nebula Device. |
Name | This shows the descriptive name of the Nebula Device. |
Model | This shows the model number of the Nebula Device. |
Usage | This shows the amount of data that has been transmitted through the Nebula Device’s uplink port. |
Top port | |
# | This shows the ranking of the Nebula Device port. |
Name | This shows the descriptive name of the Nebula Device. |
Port | This shows the port number on the Nebula Device. |
Model | This shows the model number of the Nebula Device. |
Usage | This shows the amount of data that has been transmitted through the Nebula Device’s port. |
Location This shows the location of the Nebula Devices on the map. | |