Accessory
Overview
This chapter discusses the menus that you can use to monitor the Nebula-managed Accessories in your network and configure settings even before an Accesssory is deployed and added to the site.
An Accessory can be managed by Nebula. It is referred to as a Nebula Device in this chapter.
Configuration
From the navigation panel, click Site-wide > Devices > Accessory and the following screen appears.
Site-wide > Devices > Accessories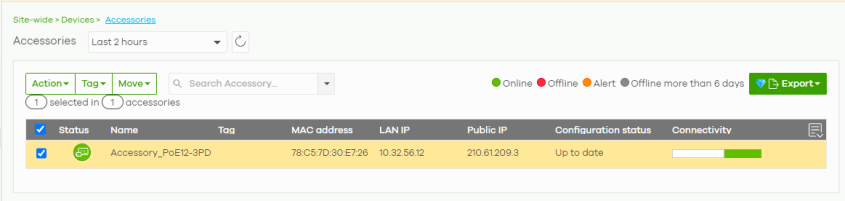
The following table describes the labels in this screen.
Label | Description |
|---|---|
Accessories | Select to view device information and connection status in the past 2 hours, day, week, month. |
 | Click this button to reload the data-related frames on this page. |
Action | Perform an action on the selected Nebula Devices. |
Reboot | Select this to restart the Nebula Device. |
Tag | Select one or multiple Nebula Devices and click this button to create a new tag for the Nebula Devices or delete an existing tag. |
Move | Select one or multiple Nebula Devices and click this button to move the Nebula Devices to another site or remove the Nebula Devices from the current site. |
Search | Specify your desired filter criteria to filter the list of Nebula Devices. |
Accessories | This shows the number of Nebula Devices connected to the site network. |
Export | Click this button to save the accessories list as a CSV or XML file to your computer. |
* | Click this to select all the rows in this table. |
Status | This shows the status of the Nebula Device. • Green: The Nebula Device is online and has no alerts. • Amber: The Nebula Device has alerts. Hover the mouse over the icon to find the problem. • Red: The Nebula Device is offline. • Gray: The Nebula Device has been offline for 7 days or more. Click the Nebula Device on this page to go to the Nebula Device’s details screen for more information. |
Name | This shows the descriptive name of the Nebula Device. |
Tag | This shows the user-specified tag for the Nebula Device. |
MAC address | This shows the MAC address of the Nebula Device. |
LAN IP | This shows the local (LAN) IP address of the Nebula Device. |
Public IP | This shows the global (WAN) IP address of the Nebula Device. |
Model | This shows the model number of the Nebula Device. |
Configuration status | This shows whether the configuration on the Nebula Device is up-to-date. |
Product information | This shows the production information of the Nebula Device. |
Connectivity | This shows the accessory connection status. The red time slot indicates the connection to the NCC is down, and the green time slot indicates the connection is up. Move the cursor over a time slot to see the actual date and time when an Nebula Device is connected or disconnected. |
Serial number | This shows the serial number of the Nebula Device. |
Firmware status | This shows whether the firmware installed on the Nebula Device is up-to-date. |
Firmware type | This shows Stable when the installed firmware may not have the latest features but has passed Zyxel internal and external testing. This shows Latest when the installed firmware is the most recent release with the latest features, improvements, and bug fixes. This shows General Availability when the installed firmware is a release before Latest, but is still undergoing Zyxel external testing. This shows Dedicated when the installed firmware is locked and Zyxel support is monitoring. Contact Zyxel customer support if you want to unlock the firmware in order to upgrade to a later one. This shows Beta when the installed firmware is a release version for testing the latest features and is still undergoing Zyxel internal and external testing. This shows N/A when the Nebula Device is offline and its firmware status is not available. |
Firmware availability | This shows whether the firmware on the Nebula Device is Up to date, there is firmware update available for the Nebula Device (Upgrade available), or a specific version of firmware has been installed by Zyxel customer support (Locked). |
Current version | This shows the firmware version currently installed on the Nebula Device. |
IP type | This shows whether the IP address was assigned automatically (DHCP), or manually (Static IP). |
 | Click this icon to display a greater or lesser number of configuration fields. For faster loading of data, select only the configuration fields listed that do NOT take a long time to fetch data. |
Accessories Details
Click a Nebula Device entry in the Site-wide > Devices > Accessories screen to display individual Nebula Device statistics.
Site-wide > Devices > Accessories: Details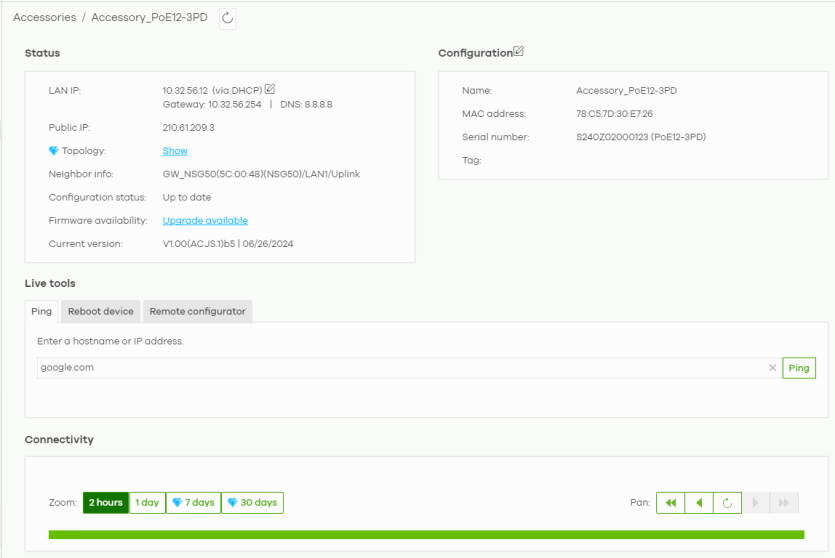
The following table describes the labels in this screen.
Label | Description |
|---|---|
 | Click this button to reload the data-related frames on this page. |
Status | |
LAN IP | This shows the local (LAN) IP address of the Nebula Device. It also shows the IP addresses of the gateway and DNS server. Click the edit icon to open a screen where you can change the IP addresses, VLAN ID number and tagging setting. 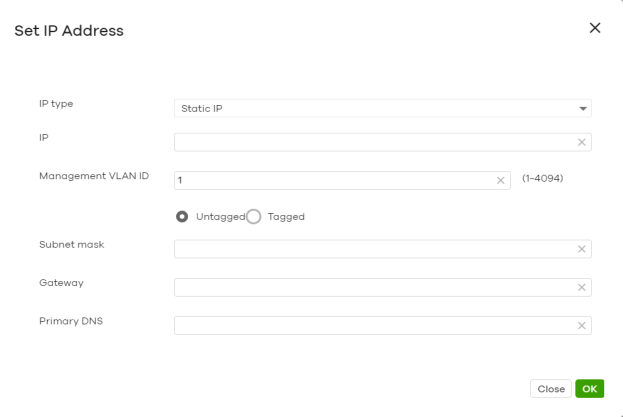 |
Public IP | This shows the global (WAN) IP address of the Nebula Device. |
Topology | |
Neighbor info | This shows the LLDP information received on the up-link port. |
Configuration status | This shows whether the configuration on the Nebula Device is up-to-date. |
Firmware availability | This shows whether the firmware on the Nebula Device is up-to-date or there is firmware update available for the Nebula Device. |
Current version | This shows the firmware version currently installed on the Nebula Device. |
Configuration Click the edit configuration icon to change the Nebula Device name and tags. You can also move the Nebula Device to another site or remove. By default, the Nebula Device’s hostname is the MAC address. Enter a Name to identify the Nebula Device. You can use up to 64 alphanumeric characters including period (.) and hyphen (-). Spaces are not allowed. | |
Name | This shows the descriptive name of the Nebula Device. |
MAC address | This shows the MAC address of the Nebula Device. |
Serial number | This shows the serial number of the Nebula Device. |
Change site | Select the new site from the drop-down menu or click Remove to remove the Nebula Device from the site. |
Tags | This shows the user-specified tag for the Nebula Device. |
Live tools | |
Ping | Enter the domain name or IP address of a computer that you want to perform ping from the Nebula Device in order to test a connection and click Ping. This can be used to determine if the Nebula Device and the computer are able to communicate with each other. |
Reboot device | Click the Reboot button to restart the Nebula Device. |
Remote configurator | This allows you to establish a remote connection to this Nebula Device by specifying the IP address and port number. Then click Establish. This feature is available to the organization owner, organization administrators with full privileges, and site administrators with full privileges. |
Connectivity Move the cursor over the chart to see the transmission rate at a specific time. | |
Zoom | Select to view the statistics in the past 2 hours, day, week, or month. |
Pan | Click to move backward or forward by one day or week. |