Security Router
Overview
This chapter discusses the menus that you can use to monitor the Nebula-managed Security Routers in your network and configure settings even before a Security Router is deployed and added to the site.
A Nebula Security Router is a router firewall that can be managed by Nebula. It is referred to as a Nebula Device in this chapter.
Monitor
Use the Monitor menus to check the Nebula Device information, client information, event log messages and threat report for the Nebula Device in the selected site.
Event Log
Use this screen to view Nebula Device log messages. You can enter a key word, select one or multiple event types, or specify a date/time or a time range to display only the log messages that match these criteria.
Select Range to set a time range or select Before to choose a specific date/time and the number of hours/minutes to display only the log messages generated within a certain period of time (before the specified date/time). Then click Search to update the list of logs based on the search criteria. The maximum allowable time range is 30 days.
Click Site-wide > Monitor > Security router > Event log to access this screen.
Site-wide > Monitor > Security router > Event log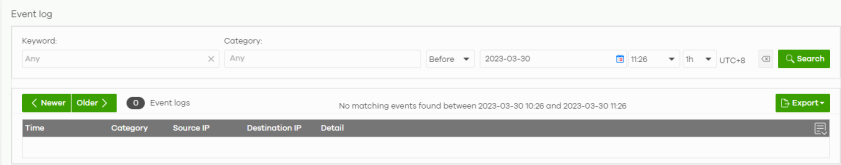
VPN Connections
Use this screen to view the status of site-to-site IPSec VPN connections.
Click Site-wide > Monitor > Security router > VPN connections to access this screen.
Site-wide > Monitor > Security router > VPN connections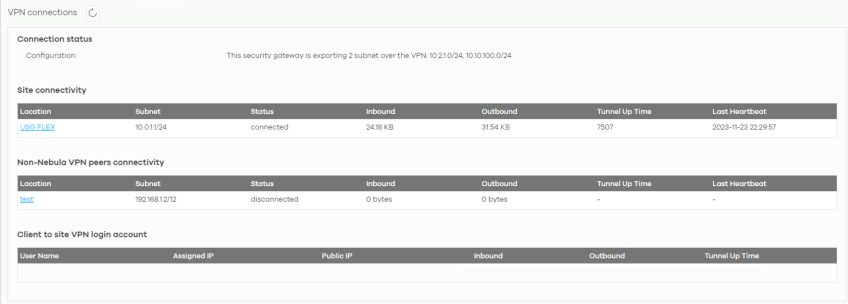
The following table describes the labels in this screen.
Label | Description |
|---|---|
 | Click this button to reload the data on this page. |
Connection Status | |
Configuration | This shows the number and address of the local networks behind the Nebula Device, on which the computers are allowed to use the VPN tunnel. |
Site Connectivity | |
Location | This shows the name of the site to which the Nebula peer gateway is assigned. Click the name to view the VPN usage and connectivity status screen. |
Subnet | This shows the address of the local networks behind the Nebula peer gateway. |
Status | This shows whether the VPN tunnel is connected or disconnected. |
Last heartbeat | This shows the last date and time a heartbeat packet is sent to determine if the VPN tunnel is up or down. |
Non-Nebula VPN peers connectivity | |
Location | This shows the name of the site to which the Non-Nebula peer gateway (Zyxel or non-Zyxel IPSec VPN gateway and Cloud VPN (Azure VPN or AWS VPN)) is assigned. Click the name to go to the Site-wide > Configure > Security router > Site-to-Site VPN screen, where you can modify the VPN settings. |
Subnet | This shows the address of the local networks behind the Non-Nebula peer gateway. |
Status | This shows whether the VPN tunnel is connected or disconnected. |
Inbound | This shows the amount of traffic that has gone through the VPN tunnel from the Non-Nebula peer gateway to the Nebula Device since the VPN tunnel was established. |
Outbound | This shows the amount of traffic that has gone through the VPN tunnel from the Nebula Device to the Non-Nebula peer gateway since the VPN tunnel was established. |
Tunnel up time | This shows how many seconds the VPN tunnel has been active. |
Last heartbeat | This shows the last date and time a heartbeat packet was sent to determine if the VPN tunnel is up or down. |
Client to site VPN login account See Remote Access VPN for information on configuring the VPN client settings on the Nebula Device. | |
User Name | This shows the VPN client’s login account name. |
Assigned IP | This shows the IP address assigned by the Nebula Device to the VPN client device for use within the VPN tunnel. |
Public IP | This shows the public IP address that the VPN client is using to connect to the site. |
Inbound | This shows the amount of traffic that has gone through the VPN tunnel from the VPN client to the Nebula Device since the VPN tunnel was established. |
Outbound | This shows the amount of traffic that has gone through the VPN tunnel from the Nebula Device to the VPN client since the VPN tunnel was established. |
Tunnel up time | This shows how many seconds the VPN tunnel has been active. |
Threat Report
Use this screen to view statistics for threat management categories. Click Site-wide > Monitor > Security router > Threat report to access this screen.
Site-wide > Monitor > Security router > Threat report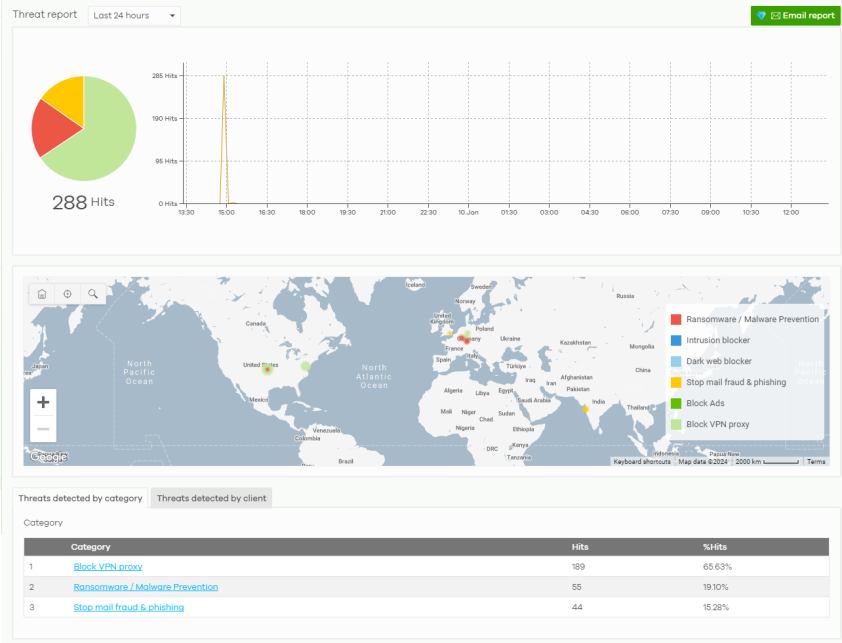
The following table describes the labels in this screen.
Label | Description |
|---|---|
Threat report | Select to view the report for the past day, week or month. Alternatively, select Custom range... to specify a time the report will span. You can also select the number of results you want to view in a table. Then, click Update. |
Email report | Click this button to send threat reports by email, change the logo and set email schedules. |
Location | This shows the location on the map where the blocked threats occurred by category. |
Threat detected by category | |
Category | This shows the name of the category to which the threat belongs. |
Domain/IP | This shows the domain name or IP address where the threat was encountered. Click the Domain/IP to display the individual category statistics table. |
Hits | This shows the amount of hits on a specific threat category. |
% Hits | This shows the percentage of the hit counts for the threat encountered by a specific category. |
Action | Click + Add to Exception to the domain name or IP address that will bypass the threat management category check. Click x Remove from Exception to remove the previously added domain name or IP address that will bypass the threat management category check. |
Threat detected by client | |
Description | This shows the name of the client device who encountered a threat. Click the name to display the individual client statistics table. |
IPv4 address | This shows the IPv4 address of the client device who encountered a threat. |
MAC address | This shows the MAC address of the client device who encountered a threat. |
Hits | This shows the number of threat hits of the client device. |
% Hits | This shows the percentage of the hit counts encountered by a specific client device. |
Action | Click Block client to prevent Internet connection to the wired and WiFi LAN client. Click Unblock Client to allow the previously blocked wired and WiFi LAN client to connect to the Internet. |
Content Filter Report
Use this screen to view statistics for content filter categories. Click Site-wide > Monitor > Security router > Content Filter report to access this screen.
Site-wide > Monitor > Security router > Content Filter report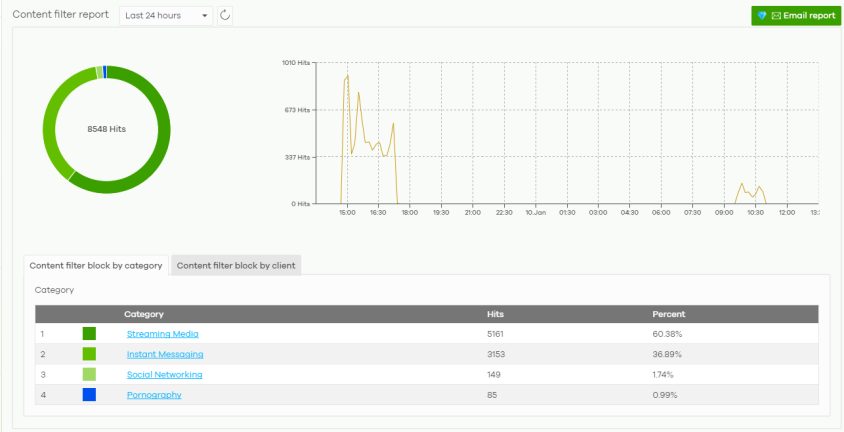
The following table describes the labels in this screen.
Label | Description |
|---|---|
Content Filter report | Select to view the report for the past day, week or month. Alternatively, select Custom range... to specify a time the report will span. You can also select the number of results you want to view in a table. Then, click Update. |
Email report | Click this button to send content filter reports by email, change the logo, set email format and schedules. Then, click Save. |
y-axis | The y-axis shows the number of hits on web pages that the Nebula Device’s content filter service has blocked. |
x-axis | The x-axis shows the time period over which the web page is checked. |
Content Filter block by category | |
Category | This shows the name of the category to which the web page belongs. Click the Category to display the individual category statistics table. |
Hits | This shows the amount of hits on a specific content filter block category. |
% Hits | This shows the percentage of the hit counts that the Nebula Device’s content filter service has blocked by a specific category. |
Content Filter block by client | |
Description | This shows the name of the client device who’s web page was blocked by the Nebula Device’s content filter service. Click the name to display the individual client statistics table. |
IPv4 address | This shows the IPv4 address of the client device who’s web page was blocked by the Nebula Device’s content filter service. |
MAC address | This shows the MAC address of the client device who’s web page was blocked by the Nebula Device’s content filter service. |
Hits | This shows the number of content filter service blocks of the client device. |
% Hits | This shows the percentage of the hit counts encountered by a specific client device. |