DASHBOARD
This chapter gives a quick introduction on the DASHBOARD screen.
The DASHBOARD screen automatically appears after you log into the Web Configurator.
New User Interface
With ZyNOS 4.80 and later, the Web Configurator’s user interface is restructured. In the new DASHBOARD screen, you can easily monitor the system status with the following tools (see DASHBOARD for more information):
• Visualized Port Status section with clickable port icons that provide information of that port, an ON/OFF switch button to enable/disable the port, and a Power Cycle button to turn the power off to the PoE port and then back on again (see Port Status).
• Visualized Cloud Control Status section that displays the NCC connection status using three connection-stage circles.
• Clickable hardware status monitoring sections that directly link to the MONITOR > System Information screen.
• Editable Quick Link section which provides shortcuts to configuration screens that you might frequently use (See Quick Links to Use).
• A Search tool on the upper right of the screen that you can use to search for the configuration screens you want to access (see Web Configurator Layout).
The left navigation panel is also restructured into task-based UI. You can display the sub-menu in the MONITOR, SYSTEM, PORT, SWITCHING, NETWORKING, SECURITY, or the MAINTENANCE section by clicking their icons. See Web Configurator Layout for more information.
Find the latest release notes in: Download Library.
DASHBOARD
This screen displays general device information, system status, system resource usage, and port status.
This guide uses XGS1935-52HP screens as an example. The screens may vary slightly for different models.
Click DASHBOARD in the navigation panel to open the following screen.
DASHBOARD (example PoE model)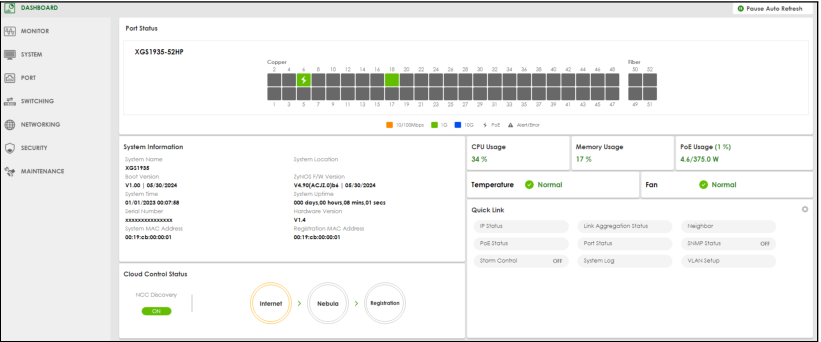
The following table describes the labels in this screen.
label | description |
|---|---|
Pause Auto Refresh | The DASHBOARD screen automatically refreshes every 30 seconds. Click this to disable the auto refresh. Click Resume Auto Refresh to enable. |
Port Status | This displays individual port type, status, and connection speed of the Switch. Click on a port to open the port’s status panel. Use the status panel to enable/disable a port, power cycle a PoE port, and view its basic information. For example, link speed and port utilization. |
System Information | |
System Name | This field displays the name used to identify the Switch on any network. |
System Location | This field displays the geographic location name you set for the Switch. |
Boot Version | This field displays the version number and date of the boot module that is currently on the Switch. |
ZyNOS F/W Version | This field displays the version number and date of the firmware the Switch is currently running. |
System Time | This field displays the current date and time in the UAG. The format is mm/dd/yyyy hh:mm:ss. |
System Uptime | This field displays how long the Switch has been running since it last restarted or was turned on. |
Serial Number | This field displays the serial number of this Switch. The serial number is used for device tracking and control. |
Hardware Version | This field displays the hardware version of the Switch. |
System MAC Address | This field displays the MAC address of the Switch. |
Registration MAC Address | This is the MAC address reserved for NCC registration. Use this MAC address to register the Switch on NCC. |
Cloud Control Status | This field displays: • The Switch Internet connection status. • The connection status between the Switch and NCC. • The Switch registration status on NCC. Mouse over the circles to display detailed information. To pass your Switch management to NCC, first make sure your Switch is connected to the Internet. Then go to NCC and register your Switch. Click Cloud Control Status or the switch button to go to the SYSTEM > Cloud Management screen. You can enable/disable NCC Discovery or view the NCC connection status in the Cloud Management screen. 1. Internet Green – The Switch is connected to the Internet. Orange – The Switch is not connected to the Internet. 2. Nebula Green – The Switch is connected to NCC. Orange – The Switch is not connected to NCC. 3. Registration Green – The Switch is registered on NCC. Gray – The Switch is not registered on NCC. |
NCC Discovery | This displays if NCC discovery is enabled on the Switch. The Switch will connect to NCC and change to the NCC management mode if it: • is connected to the Internet. • has been registered on NCC. |
CPU Usage | This displays the current CPU usage percentage. Click to go to the MONITOR > System Information screen to check the detailed information. |
Memory Usage | This displays the current RAM usage percentage. Click to go to the MONITOR > System Information screen to check the detailed information. |
PoE Usage | For PoE models. This field displays the amount of power the Switch is currently supplying to the connected PoE-enabled devices and the total power the Switch can provide to the connected PDs. It also shows the percentage of PoE power usage. When PoE usage reaches 100%, the Switch will shut down PDs one-by-one according to the PD priority which you configured in PORT > PoE Setup > PoE Setup. |
Temperature | The Switch has temperature sensors that are capable of detecting and reporting if the temperature rises above the threshold. This displays the Switch’s current device temperature level. Click to go to the MONITOR > System Information screen to check the detailed information. |
Fan | Each fan of the Switch has a sensor that is capable of detecting and reporting if the fan speed falls below the threshold. This displays the Switch’s overall fan speed status. Click to go to the MONITOR > System Information screen to check the detailed information. |
Quick Link | This section provides shortcut links to specific configuration screens. Click the edit button to choose the quick links to show. |
Port Status
The Port Status section provides visualized port status for monitoring. Each port displays a status color determined by the their link speed.
Port Status (example PoE model)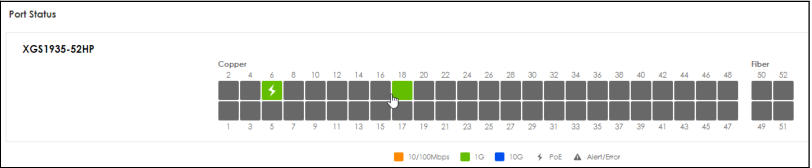
Click on a port to display a port’s status panel.
Port details Panel (example PoE model)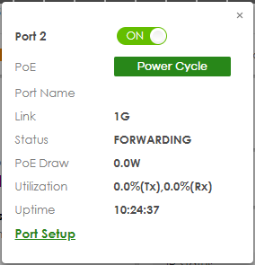
Quick Links to Use
The quick links in the Quick Link section provide shortcuts to specific configuration screens. You can use the quick links to directly access the screens that you would frequently use. You can also decide which quick links to be put on the DASHBOARD screen using the Edit button.
Quick Links (example PoE model)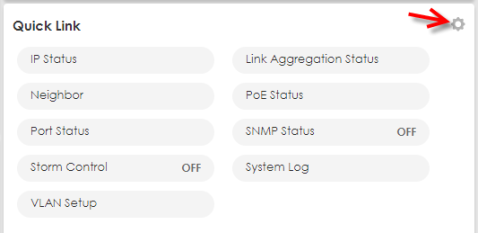
The setup panel displays after you click the Edit button.
Quick Link Selection (example PoE model)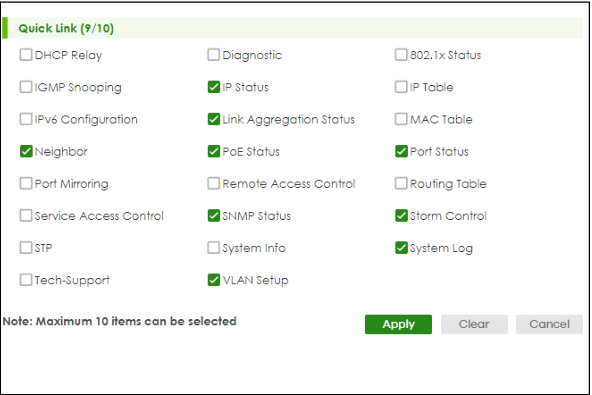
Select the quick links you want and click Apply. The selected quick links will be displayed in the Quick Link section on the DASHBOARD screen.