Site-wide
Monitor
Use the Monitor menus to check the dashboard, summary report, map and floor plan, network topology and client list of the Nebula Devices for the selected site.
Dashboard
If a site is created and selected, the Dashboard is always the first menu you see when you log into the NCC. You can also click Site-wide > Monitor > Dashboard to access this screen.
It shows the status and information for all types of Nebula Devices connected to the selected site by default.
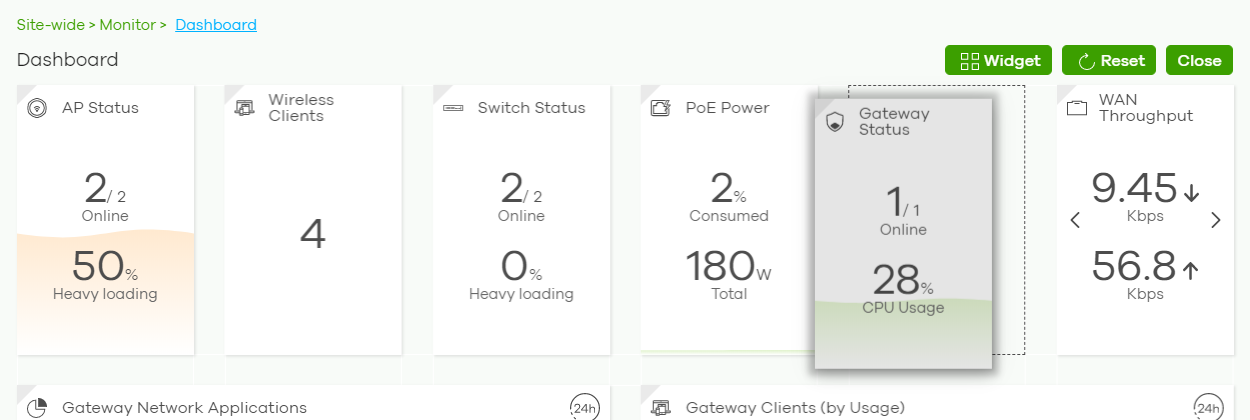
Click Customize to show the Widget, Reset and Close buttons. You can then rearrange widgets by selecting a block and holding it to move around. You can also click the Widget button to collapse, add and close individual widgets. Click Reset to return the widget settings to the defaults.
The Dashboard screen allows you to view:
• AP Status: how many Nebula APs are assigned and connected, and what percentage of the APs become overloaded, that is, the number of on-line APs that exceed the maximum client device number (in AP > Configure > Load Balancing) by total number of online APs in the site.
• Wireless Clients: how many WiFi clients are currently connected to the managed APs.
• Switch Status: how many Nebula Switches are assigned and connected, and what percentage of the Switches become overloaded, that is, the number of on-line Nebula Switches that exceed 70% of their upstream bandwidth by total number of online Nebula Switches in the site.
• PoE Power: the total PoE power budget on the Switch and the current amount of power consumed by the powered devices.
• Gateway Status: how many Nebula Security Gateways are assigned and connected, and what percentage of the Security Gateway’s processing capability is currently being used if the CPU goes over 93% usage.
• WAN Throughput: the data rate of inbound/outbound traffic in Kbps (kilobits per second) or Mbps (megabits per second) that has been transmitted through the WAN interface. If the Security Gateway supports multiple WAN interfaces and more than one are active, use the arrow to switch and view the throughput of each WAN interface.
• Gateway Network Applications: the top ten applications in the past 24 hours.
• Gateway Clients (by Usage): the top five clients of the Nebula Security Gateway with the highest percentage of bandwidth usage in the past 24 hours.
• SSIDs (by Usage): the top five SSIDs with the highest percentage of bandwidth usage in the past 24 hours. You can click a WiFi network name to go to the Access Point > Monitor > Summary Report screen.
• Wireless Clients (by Usage): the top five WiFi clients (clients of the APs only) with the highest percentage of bandwidth usage in the past 24 hours. You can click a client’s name to go to the Access Point > Monitor > Clients: Client Details screen.
• Wireless Clients Manufacturer: the top five manufacturers of WiFi client devices in the past 24 hours. You can click a manufacturer name to go to the Access Point > Monitor > Client screen and view the client devices which are made by the manufacturer.
• Wireless Clients OS: the top five operating systems used by WiFi client devices in the past 24 hours. You can click an operating system to go to the Access Point > Monitor > Client screen and view the client devices which use this operating system.
• APs (by Usage): the top five managed APs with the highest percentage of bandwidth usage in the past 24 hours. This also shows the number of WiFi clients associated with the APs. You can click an AP’s name to go to the Access Point > Monitor > Access Points: AP Details screen.
• AP Google Map: the locations of APs on the Google map.
Site-Wide > Monitor > Dashboard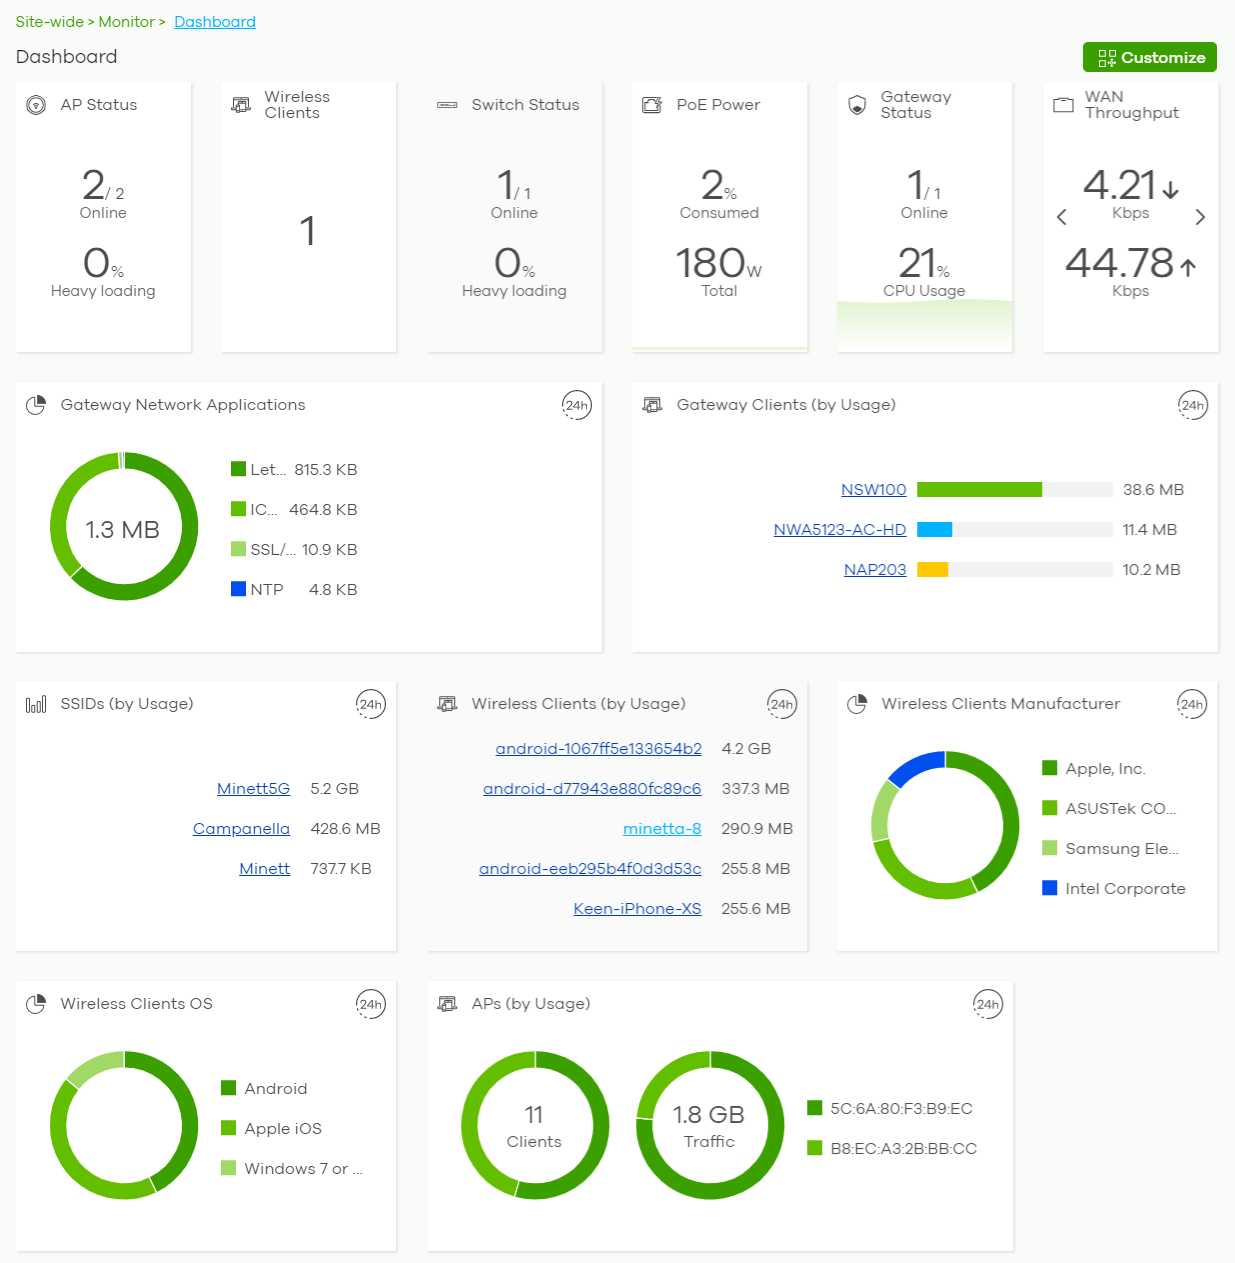
The following table describes the labels in this screen.
Label | Description |
|---|---|
AP Status | This shows the number of assigned and connected Nebula APs, and what percentage of the APs become overloaded, that is, the number of online APs that exceed the maximum client device number (in AP > Configure > Load Balancing) by total number of online APs in the site. |
Wireless Clients | This shows the number of WiFi clients currently connected to the managed APs. |
Switch Status | This shows the number of Nebula Switches assigned and connected, and what percentage of the Switches become overloaded, that is, the number of online Nebula Switches that exceed 70% of their upstream bandwidth by total number of online Nebula Switches in the site. |
PoE Power | This shows the total PoE power budget on the switch and the current amount of power consumed by the powered devices. |
Gateway Status | This shows the number of Nebula Security Gateways assigned and connected, and what percentage of the Security Gateway’s processing capability is currently being used if the CPU goes over 93% usage. |
WAN Throughput | This shows the data rate of inbound/outbound traffic in Kbps (kilobits per second) or Mbps (megabits per second) that has been transmitted through the WAN interface. If the Security Gateway supports multiple WAN interfaces and more than one are active, use the arrow to switch and view the throughput of each WAN interface. |
Gateway Network Applications | This shows the top ten applications in the past 24 hours. |
Gateway Clients (by Usage) | This shows the top five clients of the Nebula Security Gateway with the highest percentage of bandwidth usage in the past 24 hours. |
SSIDs (by Usage) | This shows the top five SSIDs with the highest percentage of bandwidth usage in the past 24 hours. You can click a WiFi network name to go to the Access Point > Monitor > Summary Report screen. |
Wireless Clients (by Usage) | This shows the top five WiFi clients (clients of the APs only) with the highest percentage of bandwidth usage in the past 24 hours. You can click a client’s name to go to the Access Point > Monitor > Clients: Client list screen. |
Wireless Clients Manufacturer | This shows the top five manufacturers of WiFi client devices in the past 24 hours. You can click a manufacturer name to go to the Access Point > Monitor > Clients screen and view the client devices which are made by the manufacturer. |
Wireless Clients OS | This shows the top five operating systems used by WiFi client devices in the past 24 hours. You can click an operating system to go to the Access Point > Monitor > Clients screen and view the client devices which use this operating system. |
APs (by Usage) | This shows the top five managed APs with the highest percentage of bandwidth usage in the past 24 hours. This also shows the number of WiFi clients associated with the APs. You can click an AP’s name to go to the Access Point > Monitor > Access Points: AP Details screen. |
AP Google Map | This shows the locations of APs on the Google map. |
Clients
This screen shows a list of all wired and wireless clients connected to Nebula Devices (APs, Switches, Security Gateways) in the site. You can also block or allow clients. Click Site-Wide > Monitor > Clients to access this screen.
Site-Wide > Monitor > Clients > Clients list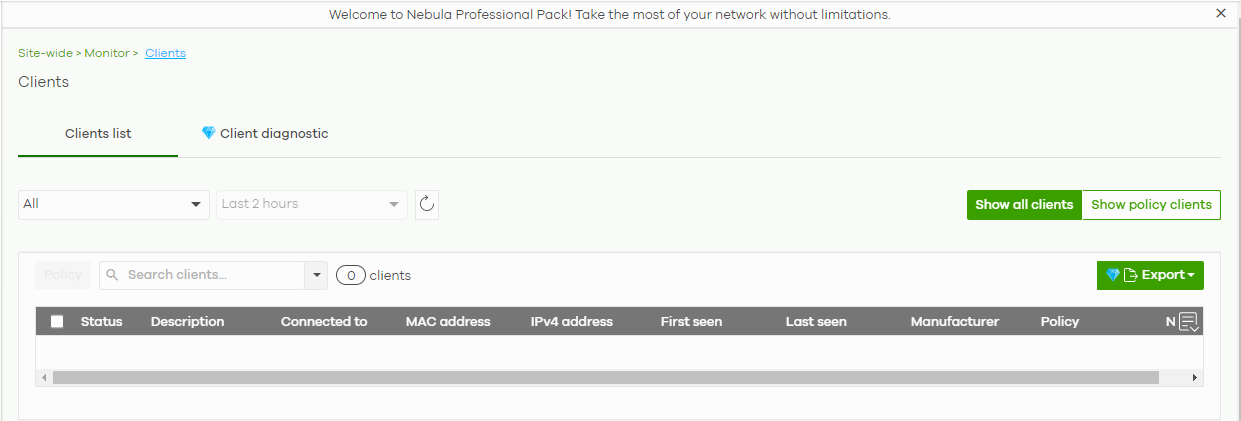
The following table describes the labels in this screen.
Label | Description |
|---|---|
Clients list | Select to filter the list of clients, based on what type of Nebula Device (access point, Switch, Security Gateway) the client is connected to. You can also set a time; the list shows each client’s connection status in the past two hours, day, week or month. |
Click this button to reload the data-related frames on this page. | |
Show all clients | Click this to show all clients that have been online during the selected time period. |
Show policy clients | Click this to show clients that have a white-listed or blocked policy applied to them, regardless of when they were last online. The client’s usage data is calculated according to the selected time period. |
Usage Move the cursor over the chart to see the transmission rate at a specific time. | |
y-axis | The y-axis shows the transmission speed of data sent or received by the client in kilobits per second (Kbps). |
x-axis | The x-axis shows the time period over which the traffic flow occurred. |
Policy | Select the clients from the table below, and then choose the security policy that you want to apply to the selected clients. Choose one of the following policies: • Allowed: The selected clients to bypass captive portal authentication. • Blocked: The selected clients cannot connect to the site. How a client is blocked depends on the connected Nebula Device type selected under Clients. AP: The client is blocked by MAC address from connecting to any AP in the site. Switch: The client is blocked by MAC address from sending or receiving network traffic. Gateway: The Security Gateway will not route traffic for the client’s IP address. • To specific SSID: Selectively apply captive portal authentication to specific SSIDs on an AP. • Normal: The selected clients have no policies applied to them. |
Search clients | Specify your desired filter criteria to filter the list of clients. |
N clients | This shows the number of clients (N) connected to the gateway in the site network. |
Add client | Click this button to open a window where you can specify a client’s name and IP address to apply a policy before it is connected to the Security Gateway’s network. |
Export | Click this button to save the client list as a CSV or XML file to your computer. |
General fields | |
Select an entry’s check box to select a specific client. Otherwise, select the check box in the table heading row to select all clients. | |
Status | This shows whether the client is online (green) or off-line (red), and whether the client is wired or wireless. • Clients connected to an AP are reported as wireless. • Clients connected to a Switch or Security Gateway are reported as wired. |
Description | This shows the descriptive name of the client. By default, this is the client’s MAC address. Click the name to display the individual client statistics. See wireless: Wireless Client Details and wired: Wired Client Details. |
Connected to | This shows the name of the Nebula Device to which the client is connected in this site. Click the Nebula Device name to display the screen where you can view detailed information about the Nebula Device. |
MAC address | This shows the MAC address of the client. Click the MAC address to display the individual client statistics. See wireless: Wireless Client Details and wired: Wired Client Details. |
IPv4 address | This shows the IP address of the client. |
First seen | This shows the first date and time the client was discovered over the specified period of time. |
Last seen | This shows the last date and time the client was discovered over the specified period of time. |
Manufacturer | This shows the manufacturer of the client hardware. |
Policy | This shows the security policy applied to the client. |
Note | This shows additional information about the client. |
LLDP | This shows the LLDP (Link Layer Discovery Protocol) information received from the client. |
Usage | This shows the amount of data consumed by the AP (upload + download) since it was last connected. |
User | This shows the user account information used to log into the NCC through captive portal, using Facebook login or 802.1x with Nebula cloud authentication or a RADIUS server. This field is blank if the user logs in through Facebook WiFi or web authentication is disabled. |
OS | This shows the operating system running on the client device. |
Click this icon to display a greater or lesser number of configuration fields. | |
AP-related fields | |
Channel | This shows the channel ID the client is using. |
Band | This shows the WiFi frequency band currently being used by the client. |
Signal strength | This shows the RSSI (Received Signal Strength Indicator) of the client’s wireless connection, and an icon showing the signal strength. Icon default thresholds: • Green/5 blocks: signal is greater than –67 dBm, strong signal • Amber/4 blocks: signal –67 to –73 dBm, average signal • Amber/3 blocks: signal –74 to –80 dBm, below average signal • Red/2 blocks: signal is less than –80 dBm, weak signal |
Security | This shows which secure encryption method is being used by the client to connect to the Nebula Device. |
Tx Rate | This shows maximum transmission rate of the client. |
Rx Rate | This shows maximum reception rate of the client. |
Download | This shows the amount of data received by the client since it was last connected. |
Upload | This shows the amount of data transmitted from the client since it was last connected. |
Association time | This shows the date and time the client associated with the Nebula Device. |
Capability | This shows the WiFi standards supported by the client or the supported standards currently being used by the client. |
Authentication | This shows the authentication method used by the client to access the network. This shows Unauthorized if the captive portal page displays but the client has not proceeded with the authentication process. The field is blank if web authentication is disabled. |
VLAN | This shows the ID number of the VLAN to which the client belongs. |
Wireless Client Details
Click a wireless client entry in the Site-Wide > Monitor > Clients > Clients list screen to display individual client statistics.
Site-Wide > Monitor > Clients > Clients list: Wireless Client Details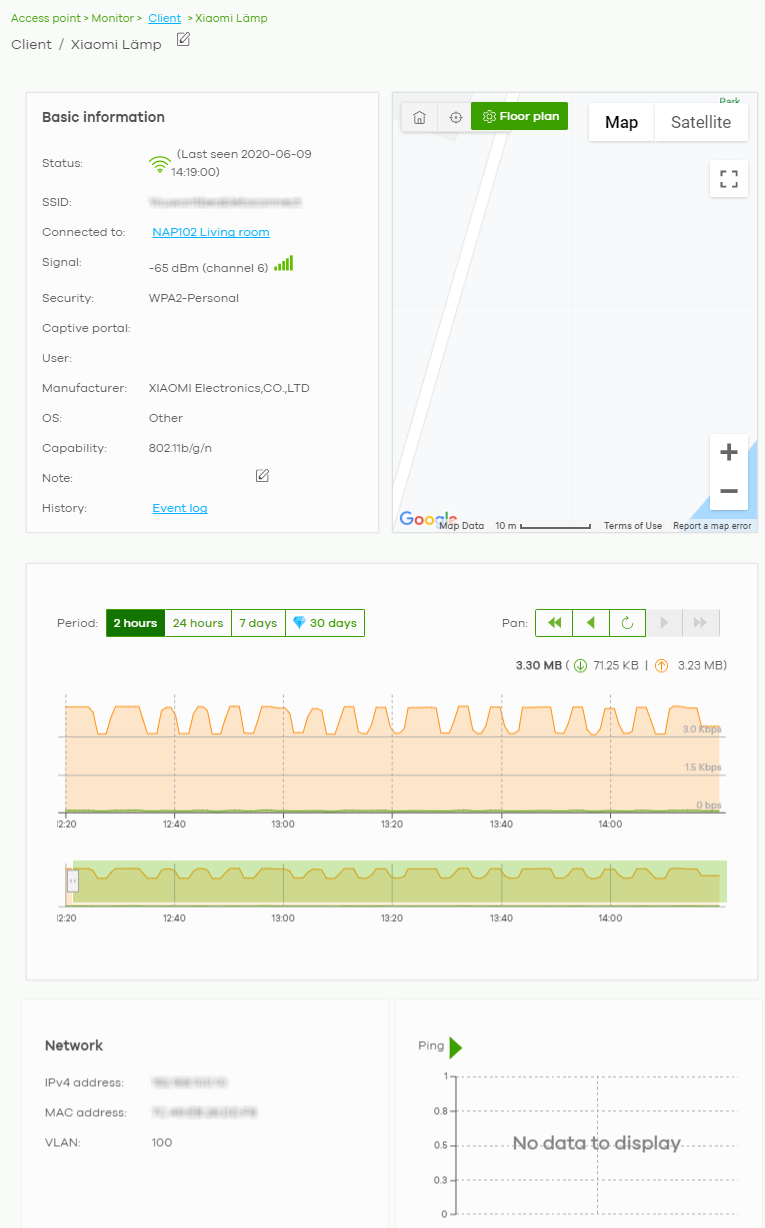
The following table describes the labels in this screen.
Label | Description |
|---|---|
Status | This shows whether the client is on-line (green), or goes off-line (red). It also shows the last date and time the client was discovered. |
SSID | This shows the name of the AP’s wireless network to which the client is connected. |
Connected to | This shows the name of the Nebula managed AP to which the client is connected. Click the name to display the individual AP statistics. See AP Details. |
Signal | This shows the RSSI (Received Signal Strength Indicator) of the client’s wireless connection, and an icon showing the signal strength. Icon default thresholds: • Green/5 blocks: signal is greater than –67 dBm, strong signal • Amber/4 blocks: signal –67 to –73 dBm, average signal • Amber/3 blocks: signal –74 to –80 dBm, below average signal • Red/2 blocks: signal is less than –80 dBm, weak signal |
Security | This shows the encryption method used to connect to the AP. |
Captive portal | This shows the web authentication method used by the client to access the network. |
User | This shows the number of users currently connected to the network through the client device. |
Manufacturer | This shows the manufacturer of the device connected to the AP. |
OS | This shows the operating system running on the client device, if known. |
Capability | This shows the WiFi standards supported by the client or the supported standards currently being used by the client. |
Note | This shows additional information for the client. Click the edit icon to change it. |
History | Click Event log to go to the Access Point > Monitor > Event log screen. |
Map | This shows the location of the client on the Google map. |
Period | Select to view the statistics in the past two hours, day, week or month. |
Pan | Click to move backward or forward by two hours or one day. |
y-axis | The y-axis shows the transmission speed of data sent or received by the client in kilobits per second (Kbps). |
x-axis | The x-axis shows the time period over which the traffic flow occurred. |
Network | |
IPv4 address | This shows the IP address of the client. |
MAC address | This shows the MAC address of the client. If you applied a security policy to a client using the Add client button in the Access Point > Monitor > Clients screen, and the client has never been connected to the AP’s network, an edit icon appears allowing you to modify the client’s MAC address, |
VLAN | This shows the ID number of the VLAN to which the client belongs. |
Ping | Click the button to ping the client’s IP address from the Nebula AP to test connectivity. |
Loss rate | This shows the rate of packet loss when you perform ping. |
Average latency | This shows the average latency in ms when you perform ping. |
Wired Client Details
Click a wired client’s descriptive name in the Site-Wide > Monitor > Clients > Clients list screen to display individual client statistics.
Site-Wide > Monitor > Clients > Clients list: Wired Client Details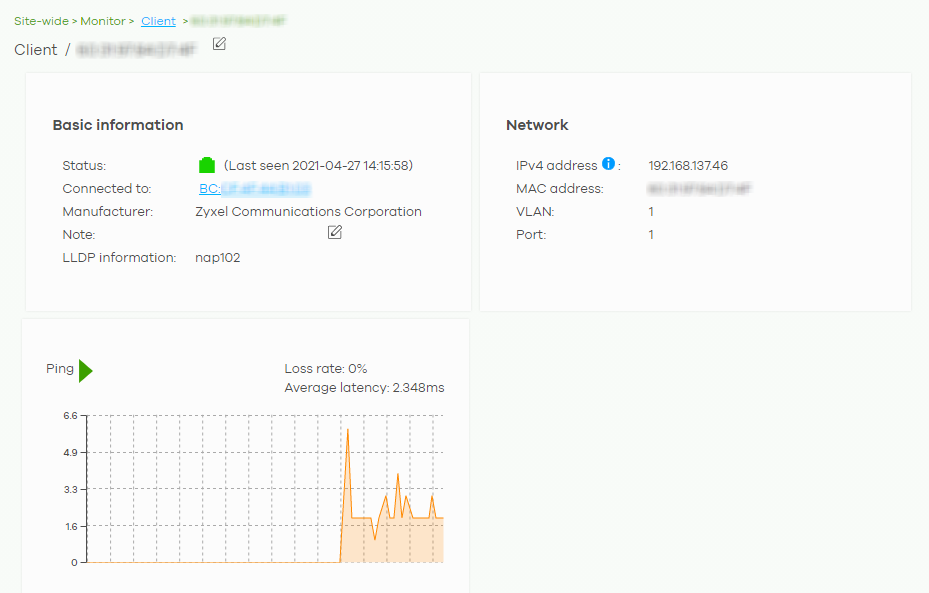
The following table describes the labels in this screen.
Label | Description |
|---|---|
Client | Click the edit icon to change the client name. |
Status | This shows whether the client is on-line (green) or off-line (red). It also shows the last date and time the client was discovered, and whether the client is wired or wireless. |
Connected to | This shows the name of the Security Gateway to which the client is connected. |
User | This shows the number of users currently connected to the network through the client device. |
Manufacturer | This shows the manufacturer of the client device. |
OS | This shows the operating system running on the client device, if known. |
Note | Enter information about this Nebula Device, for yourself or for other administrators. |
History | Click Event log to go to the Firewall > Monitor > Event log screen. |
LLDP information | This shows the LLDP (Link Layer Discovery Protocol) information received from the remote device. |
Network | |
IPv4 address | This shows the IP address of the client. |
Interface | This shows the interface on the Security Gateway to which the client belongs. |
Port forwarding | This shows the port forwarding rules set for this client. |
Public IP | This shows the port forwarding and 1:1 NAT IP addresses for each 1:1 NAT rule configured for this client. |
Period | Select to view the client connection status in the past two hours, day, week or month. |
Pan | Click to move backward or forward by two hours or one day. |
y-axis | The y-axis shows the transmission speed of data sent or received by the client in kilobits per second (Kbps). |
x-axis | The x-axis shows the time period over which the traffic flow occurred. |
Top Application | A donut chart shows the percentage of usage for each application used by the client, if any. The number in the center of the donut chart indicates the amount of the application’s traffic which has been transmitted or received by the client. Click View More to display the application statistics. Click Hide Info to hide them. |
Application | This shows the name of the application. Click an application name to view information about the clients who used the application. For details, see Applications. |
Category | This shows the name of the category to which the application belongs. |
Usage | This shows the total amount of data consumed by the application used by the client. |
% Usage | This shows the percentage of usage for the application used by the client. |
Ping | Click the button to ping the client’s IP address from the gateway to test connectivity. |
Client Diagnostic
Use this screen to view all related event logs between APs and wireless clients, and DHCP logs of Nebula Security Gateways / Security Firewalls (NSG, ZyWALL USG FLEX, ATP, and USG20W-VPN). Association, Authentication, Disconnection, and DHCP event logs that occur are summarized in chronological order to aid in troubleshooting. Click Site-Wide > Monitor > Clients > Client diagnostic to access this screen.
Note: This feature is available for Nebula Pro Pack license only.
Site-Wide > Monitor > Clients > Client diagnostic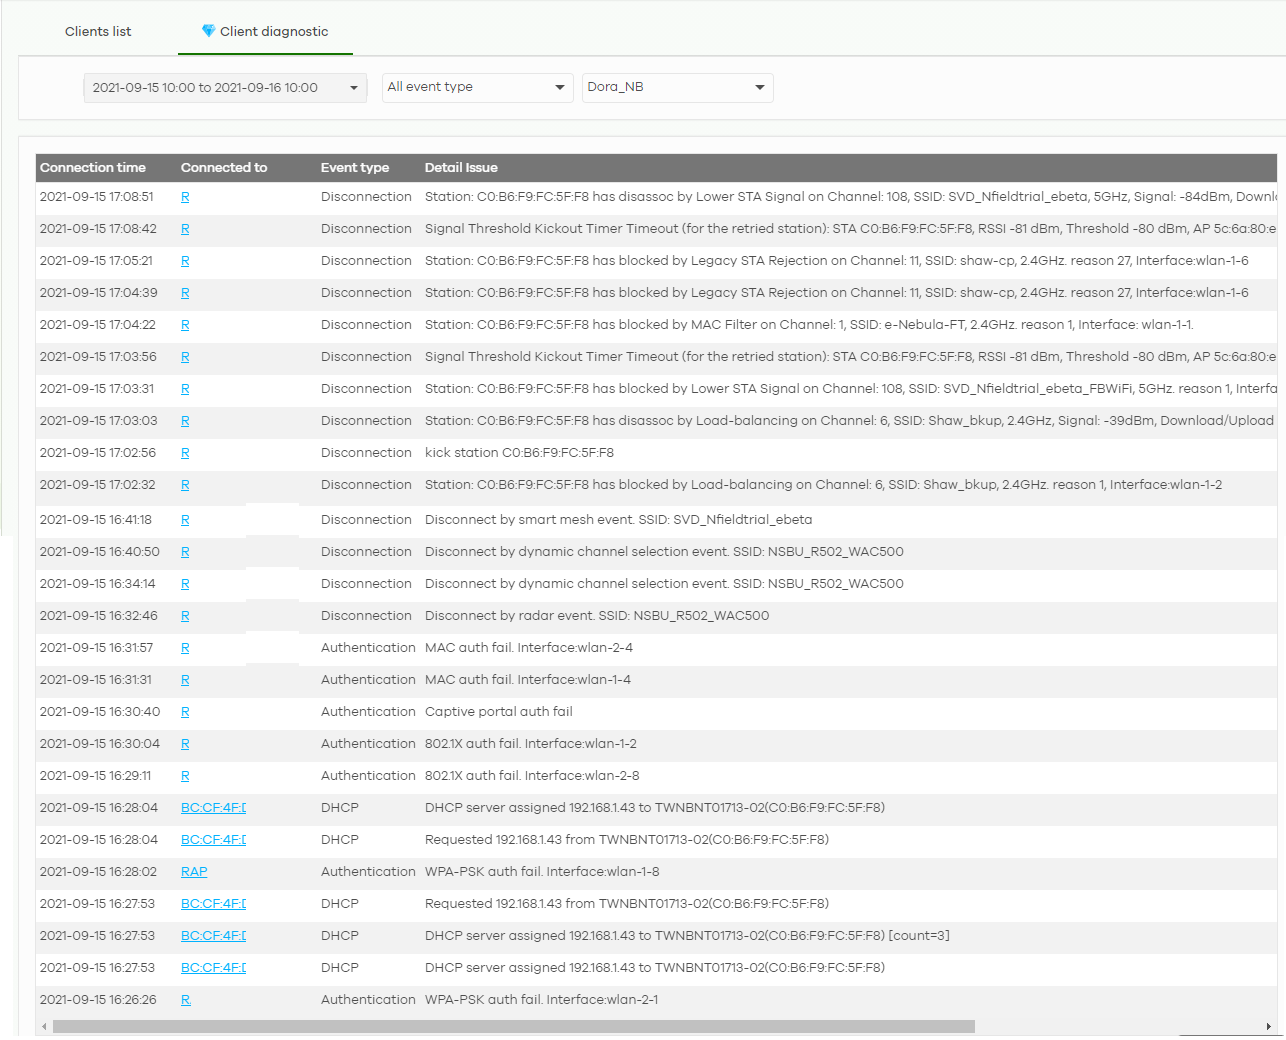
The following table describes the labels in this screen.
Label | Description |
|---|---|
Clients list | Select a time; the list shows each client’s event logs in the past hour, last 12 hours, last day, or custom range (from 15 minutes to one day within the last month). Select to filter the list of client’s event logs, based on the event type (Association, Authentication, Disconnect, DHCP) that occurred. Select the client, only one client can be selected. |
Connection time | This shows the starting time period from which the event log is recorded. |
Connected to | This shows the name (if available) or MAC address of the connected client. |
Event type | This shows the event type (Association, Authentication, Disconnection, DHCP) that occurred. |
Detail issue | This shows a summary of the APs and Security Gateways / Security Firewalls (NSG, USG FLEX, ATP, and USG20W-VPN) event logs in chronological order. |
Containment List
This screen shows a list of clients that are currently blocked in the site by the CDR security service. You can use this screen to release blocked clients. Click Site-Wide > Monitor > Containment List to access this screen.
Site-Wide > Monitor > Containment List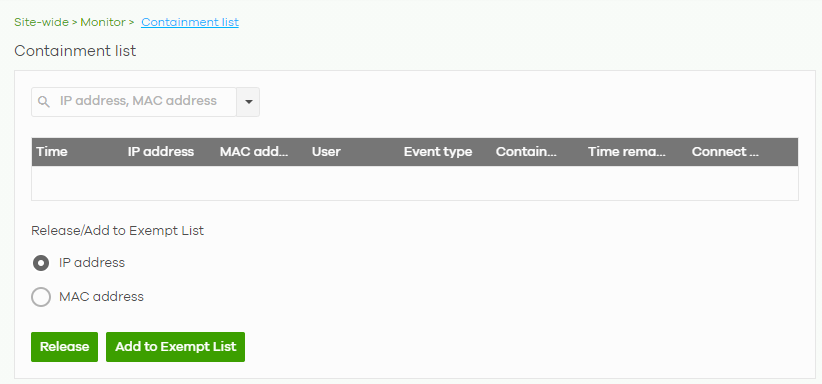
The following table describes the labels in this screen.
Label | Description |
|---|---|
Search | Enter a MAC or IP address to filter the list of clients. |
Time | This field displays the date and time CDR contained this client. |
IP Address | This field displays the IPv4 address of the client contained by CDR. |
MAC Address | This field displays the MAC address of the client contained by CDR. |
User | The field displays the user name of a client contained by CDR who has been authenticated for Internet access. The field is blank if user authentication is not required. |
Event Type | This field displays details on the category of signature that triggered CDR: Web Filtering, Anti-Malware or IPS (IDP). |
Containment | This field displays if the client is blocked, quarantined or just triggers an alert. |
Time Remaining (mins.) | This field displays the amount of time left until this client is released by CDR. |
Connect to | This field displays the description of the AP or the interface of the Nebula Device that the contained client is connected to. |
Release/Add to Exempt List | |
Release | Select a client and then click this to release this Nebula Device from CDR containment. |
Add to Except List | Select a client, select IP address or MAC address, and then click this to release this Nebula Device from CDR containment. This Nebula Device’s IP or MAC address is except from future CDR checking |
Map & Floor Plans
This screen allows you to locate a Nebula Device on the world map and use a floor plan to show where Nebula Devices are physically located. Click Site-Wide > Monitor > Map & floor plans to access this screen.
Site-Wide > Monitor > Map & Floor Plans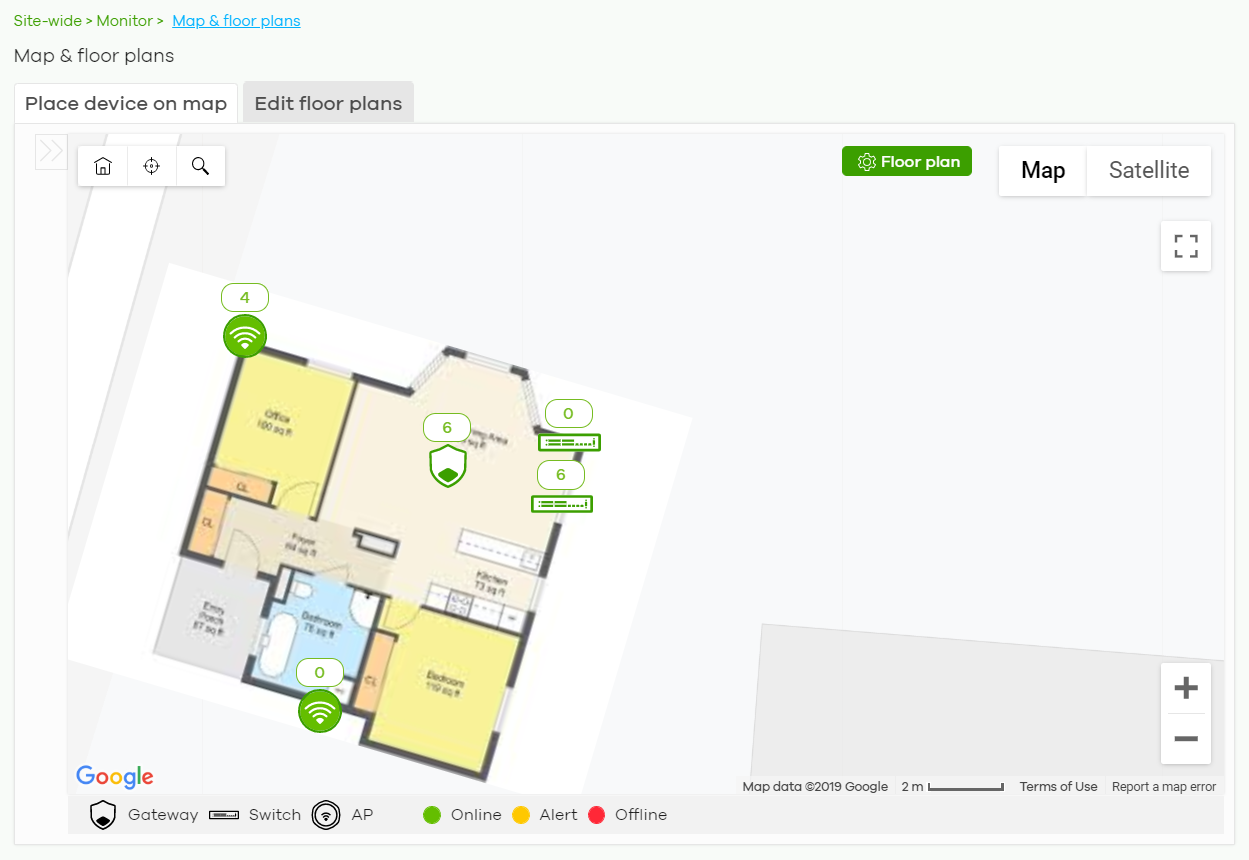
Place devices on map
You can mark on the map the places where the Nebula Devices are located. Click the Place device on map tab to display the Nebula Device list for the selected site. Click the arrow ( ) on the upper left corner of the Map & floor plans screen to collapse or expand the list.
Click the Placed button to show the Nebula Devices that you have pinned on the map and/or the floor plan. Click the Un-placed button to show the Nebula Devices that remain to be pinned on the map. To pin a Nebula Device, select the Nebula Device from the Un-placed list, then drag and drop it on the map.
The pin icon next to a Nebula Device name is green ( ) if you have marked the Nebula Device on the map. Otherwise, the pin icon is gray (
 ). Click the
  icon to remove a Nebula Device from the map.
Site-Wide > Monitor > Map & Floor Plans: Place device on map
Edit floor plans
Click the Edit floor plans tab to display the list of existing floor plan, a drawing that shows the rooms scaled and viewed from above. Click the arrow () on the upper left corner of the Map & floor plans screen to collapse or expand the list.
Use the Create+ button to upload a new floor plan. The floor plan then shows on the Google map at the right side of the screen. Use your mouse to move the floor plan, and use the icons at the top of the map to rotate, change the transparency, resize or hide the floor plan. Click Set position to apply your changes. If you want to relocate the floor plan, select the floor plan from the list and click its edit icon.
Site-Wide > Monitor > Map & Floor Plans: Edit floor plans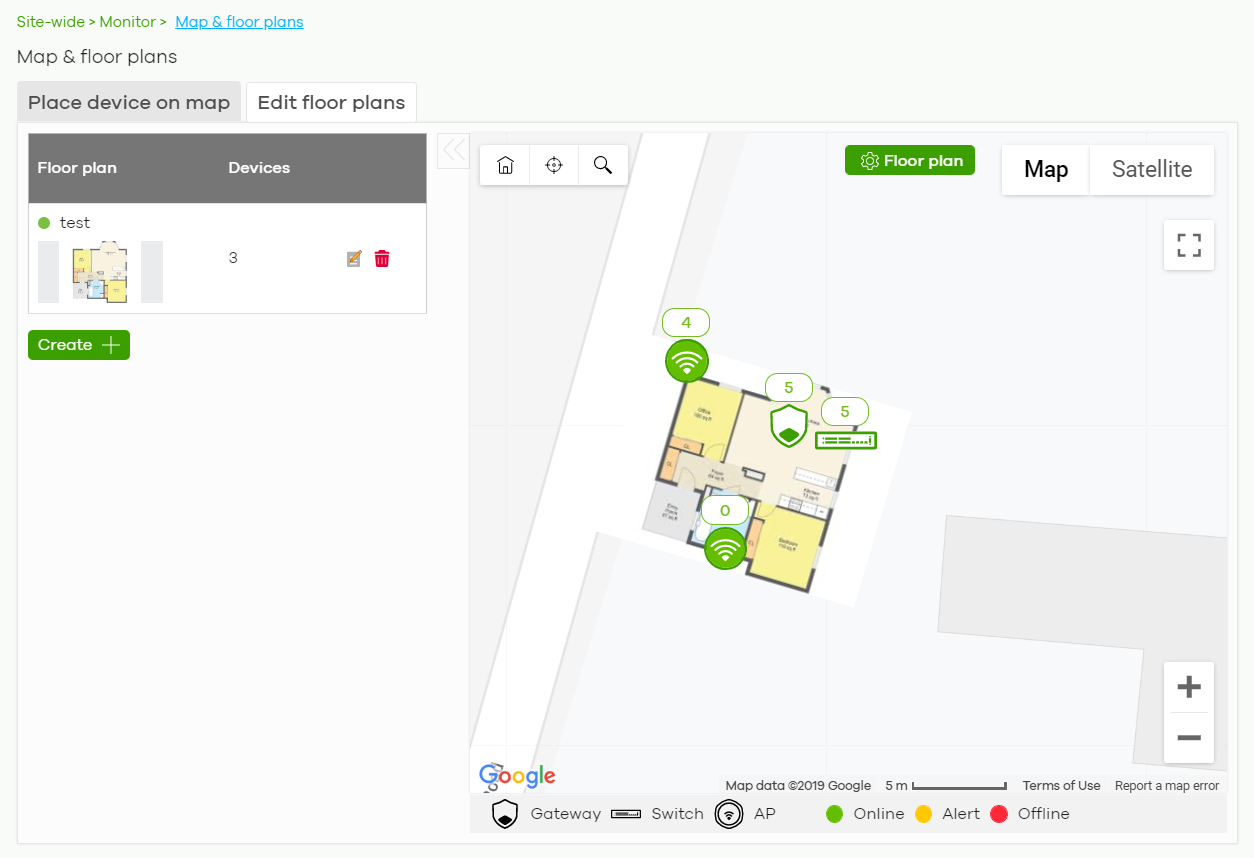
The following table describes the labels in this screen.
Label | Description |
|---|---|
Floor plan | This shows the descriptive name of the floor plan. |
Devices | This shows the number of the Nebula Devices marked on this floor plan. |
 | Click this icon to open a screen, where you can modify the name, address and/or dimension of the floor plan. |
 | Click this icon to delete the floor plan. |
Topology
Use this screen to view the links between Nebula Devices in the site. Click Site-Wide > Monitor > Topology to access this screen.
The icon of a node in the network topology indicates its Nebula Device type and the color shows whether the Nebula Device is on-line (green), has alerts (amber), or is off-line (red).
Move the pointer over a node to view detailed Nebula Device information, such as its name, model number, number of connected clients, and MAC address. Click Reboot to restart the Nebula Device.
Move the pointer over a link to view link details, such as type (Ethernet or wireless mesh), speed, and data usage from the past 24 hours. If the link is supplying power to a node using Power over Ethernet (PoE), you can click Reset to perform a power cycle on the port. This action temporarily disables PoE and then re-enables it, in order to reboot connected PoE devices.
Enable Label all devices to show Nebula Device information, such as MAC address in the network topology diagram.
Enable Show redundant links to display the secondary connection between two nodes, if any.
Enable Show other devices to also display the Nebula Devices that are connected to your network but cannot be identified by the NCC. This on/off switch button is configurable only when there is a non-Nebula Device installed in the network and detected by the NCC through LLDP packets.
Zyxel device is a device manufactured by Zyxel but not registered at the NCC or unable to work in Nebula cloud management mode.
Site-Wide > Monitor > Topology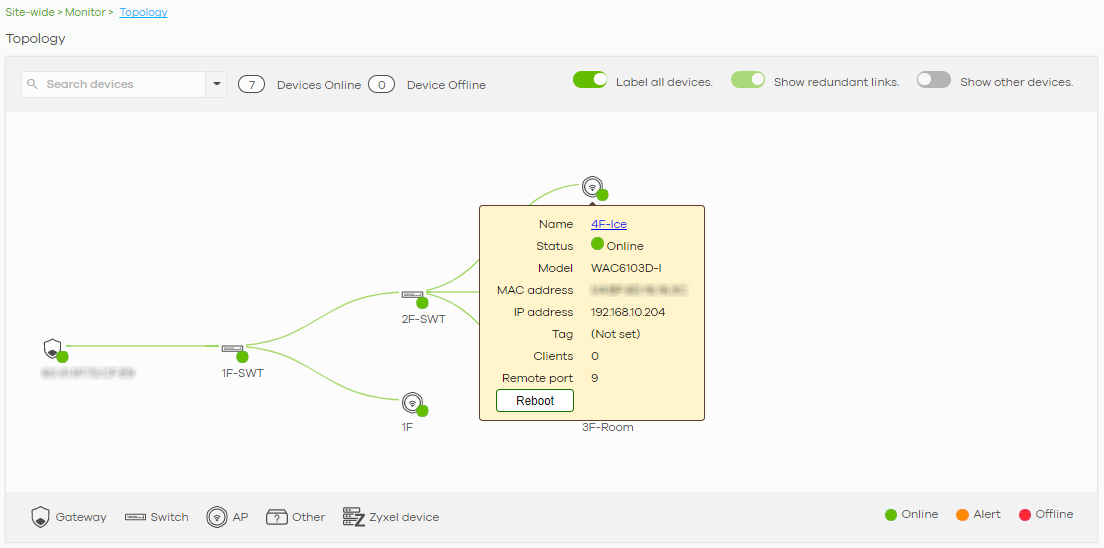
Vouchers
A voucher is a unique printable code that allows a user to authenticate with a WiFi network for a limited period of time. A user connects to the WiFi network’s SSID and then enters the code in a captive portal. After a successful login, the expiry time of the voucher starts counting down.
Vouchers are useful in situations where you want to give individual users time-limited WiFi access. For example: A customer can purchase a voucher for two hours of Internet access in a hotel or coffee shop.
Note: You can only enable voucher authentication for one SSID per site.
Using Vouchers
1 Go to Access Point > Configure > SSID Overview, and create a dedicated SSID for voucher-based WiFi access. For example, “Hotel_Guest_Network”.
For details on configuring SSIDs, see SSID Overview.
For details on configuring SSIDs, see SSID Overview.
2 Go to Access Point > Configure > Authentication, select the SSID, and then under Sign-in method select Voucher.
For details, see SSID Settings.
For details, see SSID Settings.
3 Go to Site-wide > Configure > General settings > Voucher Settings to configure how the vouchers will look when printed.
For details, see General Settings.
For details, see General Settings.
4 Go to Site-Wide > Monitor > Vouchers, and then click Create to create one or more vouchers.
Vouchers Screen
This screen allows you to create and manage vouchers for WiFi network authentication.
Click Site-Wide > Monitor > Vouchers to access this screen.
Site-Wide > Monitor > Vouchers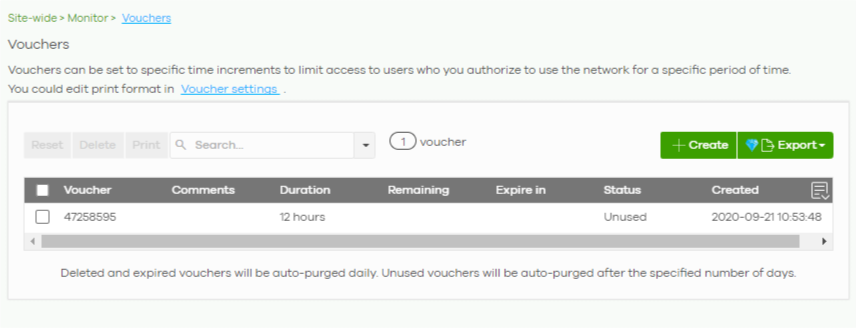
The following table describes the labels in this screen.
Label | Description |
|---|---|
Reset | Select one or more vouchers and then click this button to reset the vouchers back to their original states. Each voucher’s status is set to Unused and time remaining is reset to the time configured in Duration. |
Delete | Select one or more vouchers and then click this button to delete the vouchers. |
Print | Select one or more vouchers and then click this button to print the vouchers. You can modify how vouchers look when printed at Site-wide > Configure > General Settings. |
Search | Use this field to search for vouchers, by voucher code, duration, and/or status. |
Create | Click this button to create one or more vouchers. For details, see Create Vouchers Screen. |
Export | Click this button to export the voucher table and all information in it to a CSV or XML file. |
Voucher | This displays the voucher’s unique authentication code. |
Comments | This displays information about the voucher. |
Duration | This displays how long the voucher is valid from when it is activated, in hours. |
Remaining | This displays how much time is left before the voucher expires. NCC only starts counting this time after the voucher has been activated. |
Expire in | This displays the date and time that the voucher will expire. |
Status | This displays the current status of the voucher: Unused: The voucher has not yet been used for authentication. Active: A user has used the voucher for authentication. NCC has started counting down the duration. Expire: The voucher has reached the end of its duration period and can no longer be used. Delete: The voucher is unused and has reached the time set under Purge after (days). |
Created | This displays the date and time that the voucher was created. |
Create Vouchers Screen
Use this screen to create one or more new vouchers.
Site-Wide > Monitor > Vouchers > Create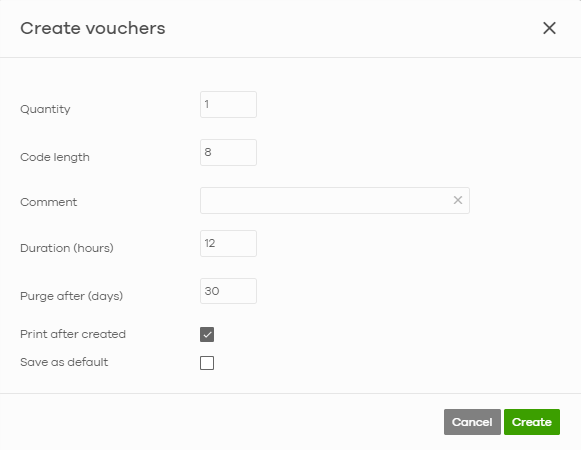
The following table describes the labels in this screen.
Label | Description |
|---|---|
Quantity | Sets the number of vouchers you want to create. The valid range for this setting is 1 – 999. |
Code length | Sets the length of the unique code on each voucher. The valid range for this setting is 6 – 10. |
Comment | Enter information about the voucher that might be useful for other administrators. |
Duration (hours) | Sets how long the voucher is valid after it has been activated, in hours. The valid range for this setting is 1 – 72. |
Purge after (days) | Sets how long a non-activated voucher is valid for, in days. The valid range for this setting is 1 – 180. |
Print after created | Select this to print the vouchers immediately after clicking Create. |
Save as default | Click this to make the settings on this page the default settings for new vouchers. |
Note: Dynamic Personal Pre-Shared Keys (DPPSKs) also allow you to give individual users a printable password and time-limited WiFi access. For details, see SSID Settings.
Cloud Intelligence Logs
This screen displays events from the Security Gateway within the selected site, such as CDR service events, alerts, and firmware management.
Click Site-Wide > Monitor > Cloud Intelligence Logs to access this screen.
Site-Wide > Monitor > Cloud Intelligence Logs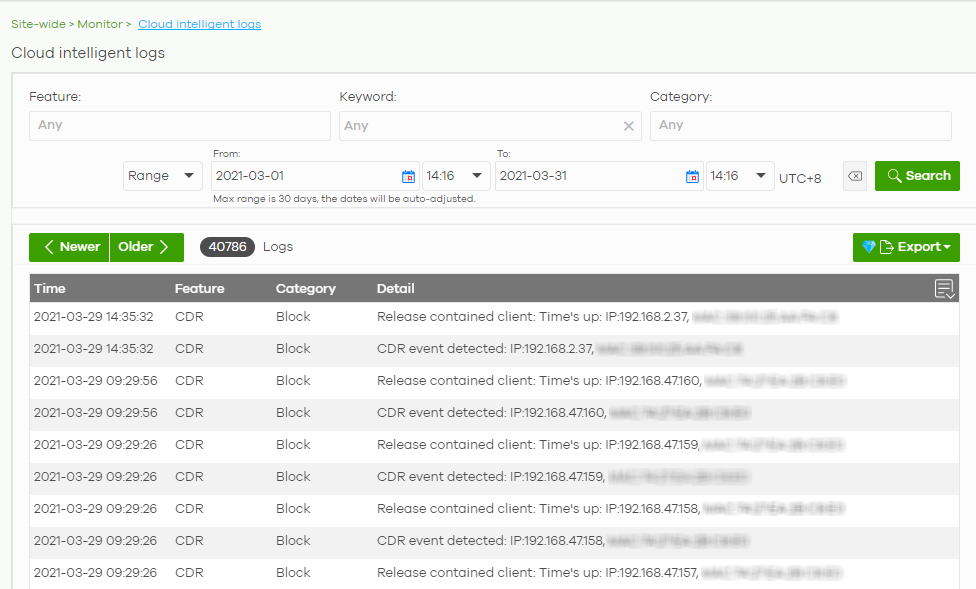
The following table describes the labels in this screen.
Label | Description |
|---|---|
Feature | Select the features that you want to view logs for. |
Keyword | Enter a keyword to filter the list of log entries. |
Category | Select the type of log messages you want to view. The available categories will depend on the features you have selected under Feature. |
Range/Before | Select filtering options, set a date, and then click Search to filter log entries by date. Range: Display log entries from the first specified date to the second specified date. Before: Display log entries from the beginning of the log to the selected date. |
Reset filters | Click this to return the search criteria to the previously saved time setting. |
Search | Click this to update the list of logs based on the search criteria. |
Newer/Older | Click to sort the log messages by most recent or oldest. |
N Logs | This shows the number of log messages (N) in the list. |
Export | Click this button to download the log list as a CSV or XML file to your computer. |
Time | This shows the date and time when the log was recorded. It uses the local time set for the site at Site-wide > Configure > General settings. |
Feature | Select the feature that created the log message. |
Category | This shows the type of log message, for example “Block”. The available categories will depend on the feature. |
Detail | This shows the details of the event. |
Click this icon to display a greater or lesser number of configuration fields. |
Summary Report
Use this screen to view statistics for the Nebula Devices and networks in the selected site.
Click Site-wide > Monitor > Summary Report to access this screen.
Site-wide > Monitor > Summary Report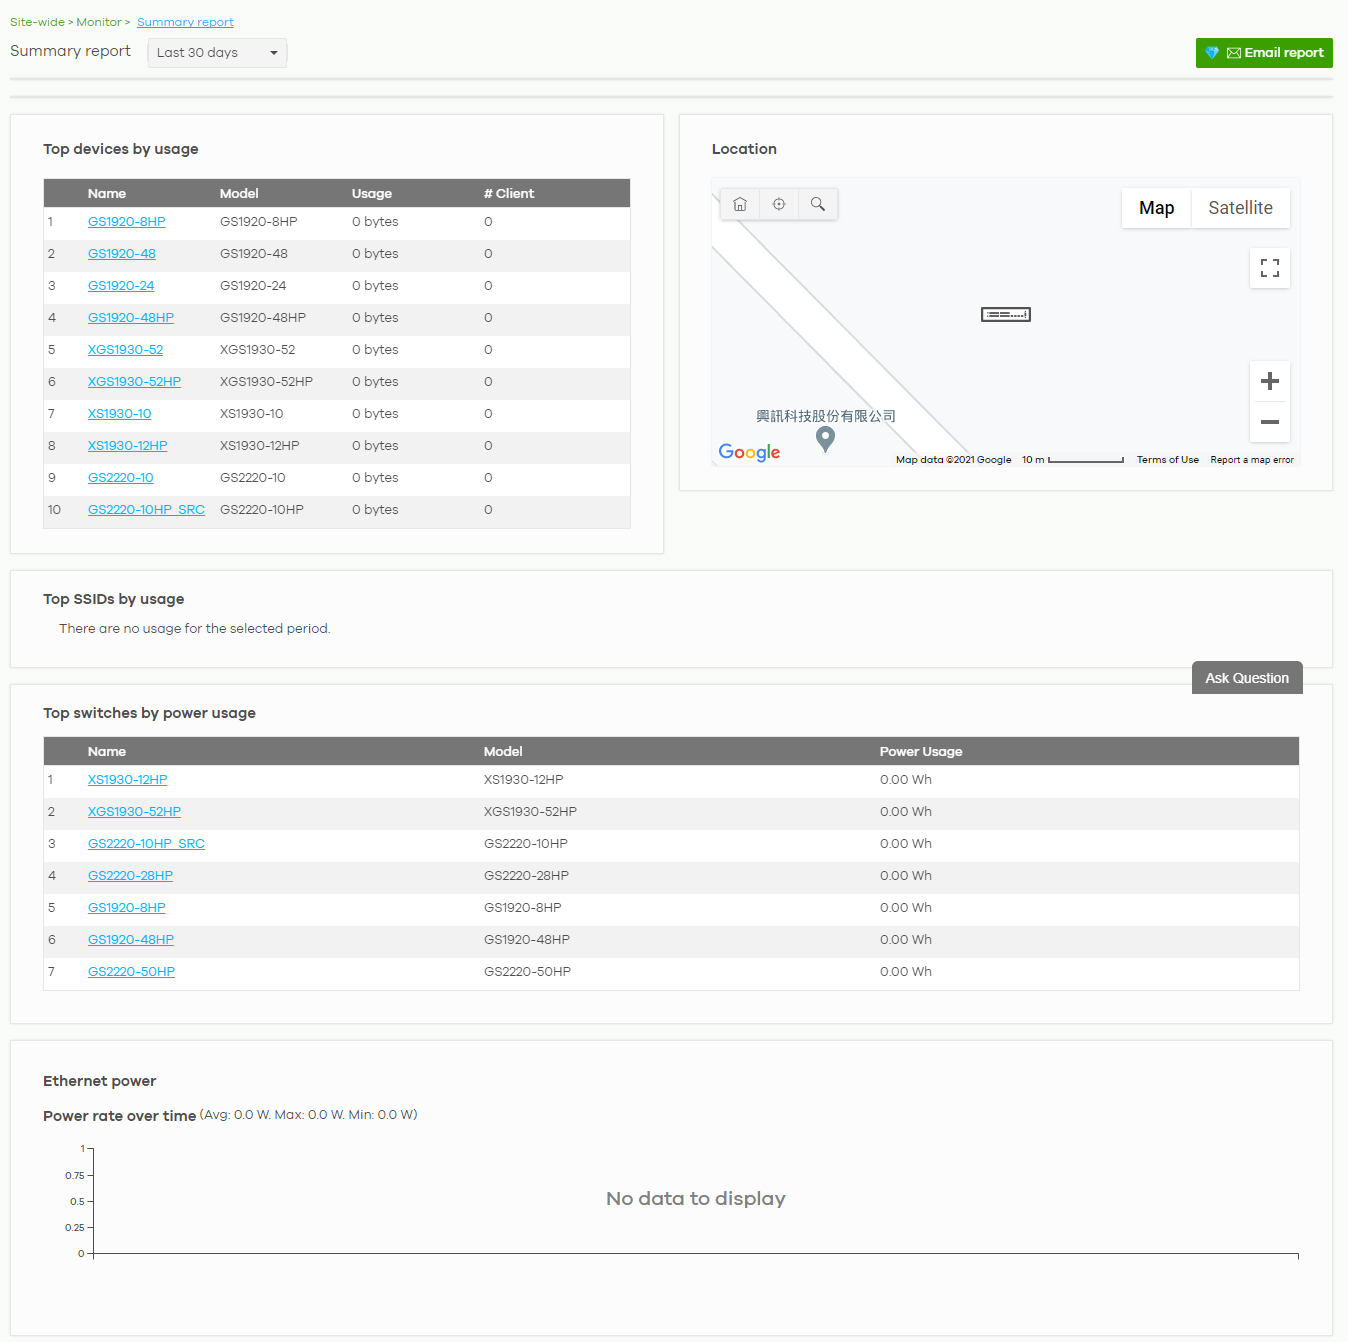
The following table describes the labels in this screen.
Label | Description |
|---|---|
Summary report | Select to view the report for the past day, week or month. Alternatively, select Custom range... to specify a time period the report will span. You can also select the number of results you want to view in a table. |
Email report | Click this button to send summary reports by email, change the logo and set email schedules. |
Top devices by usage | |
This shows the index number of the Nebula Device. | |
Name | This shows the descriptive name of the Nebula Device. You can click the name to view the Nebula Device details. |
Model | This shows the model number of the Nebula Device. |
Usage | This shows the amount of data that has been transmitted by or through the Nebula Device. |
Client | This shows the number of clients currently connected to the Nebula Device. |
Location This shows the location of the site’s gateway device on the map. | |
Top SSIDs by usage | |
# | This shows the ranking of the SSID. |
SSID | This shows the SSID network name. |
Encryption | This shows the encryption method use by the SSID network. |
# Client | This shows how many WiFi clients are connecting to this SSID. |
% Client | This shows what percentage of associated WiFi clients are connecting to this SSID. |
Usage | This shows the total amount of data transmitted or received by clients connecting to this SSID. |
% Usage | This shows the percentage of usage for the clients connecting to this SSID. |
Top switches by power usage | |
# | This shows the ranking of the Nebula Switch. |
Name | This shows the descriptive name of the Nebula Switch. |
Model | This shows the model number of the Nebula Switch. |
Power Usage | This shows the total amount of power consumed by the Nebula Switch’s connected PoE devices during the specified period of time. |
Ethernet power | This graph shows power used by all PoE Switch ports in the site within the specified time, in Watts. |
Avg | This shows the average power consumption for all Switch ports. |
Max | This shows the maximum power consumption of the Switch ports. |
Min | This shows the minimum power consumption of the Switch ports. |
y-axis | The y-axis shows how much power is used by all Switches in the site, in Watts. |
x-axis | The x-axis shows the time period over which the power consumption is recorded. |
Applications
This screen displays usage statistics for applications used in the site. An application can be a specific app or service (for example, Facebook) or a general protocol (for example, HTTP). You can also block or restrict bandwidth for applications at the gateway, and for multiple applications by category.
Click Site-Wide > Monitor > Applications to access this screen.
Note: You can view this screen by application or by category.
Site-Wide > Monitor > Applications: Application View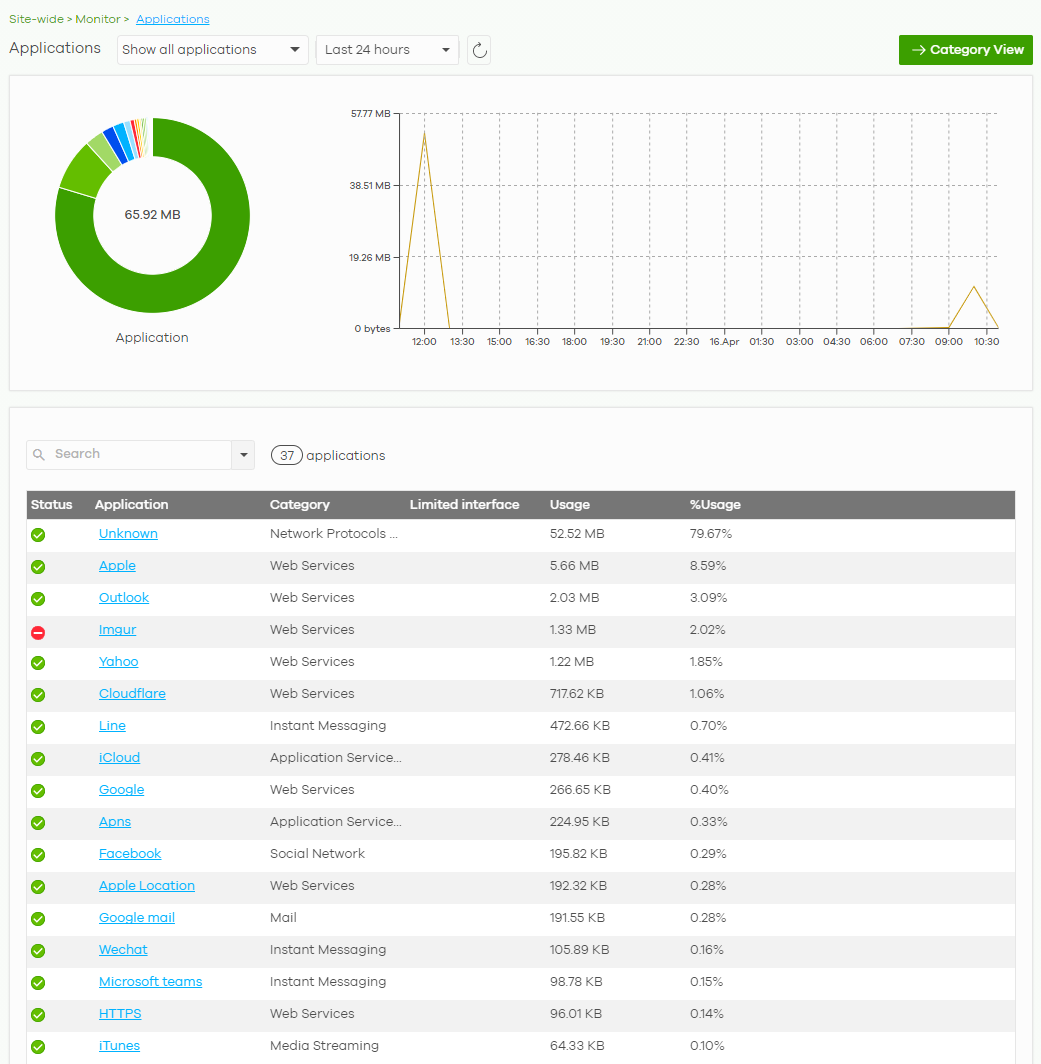
Site-Wide > Monitor > Applications: Category View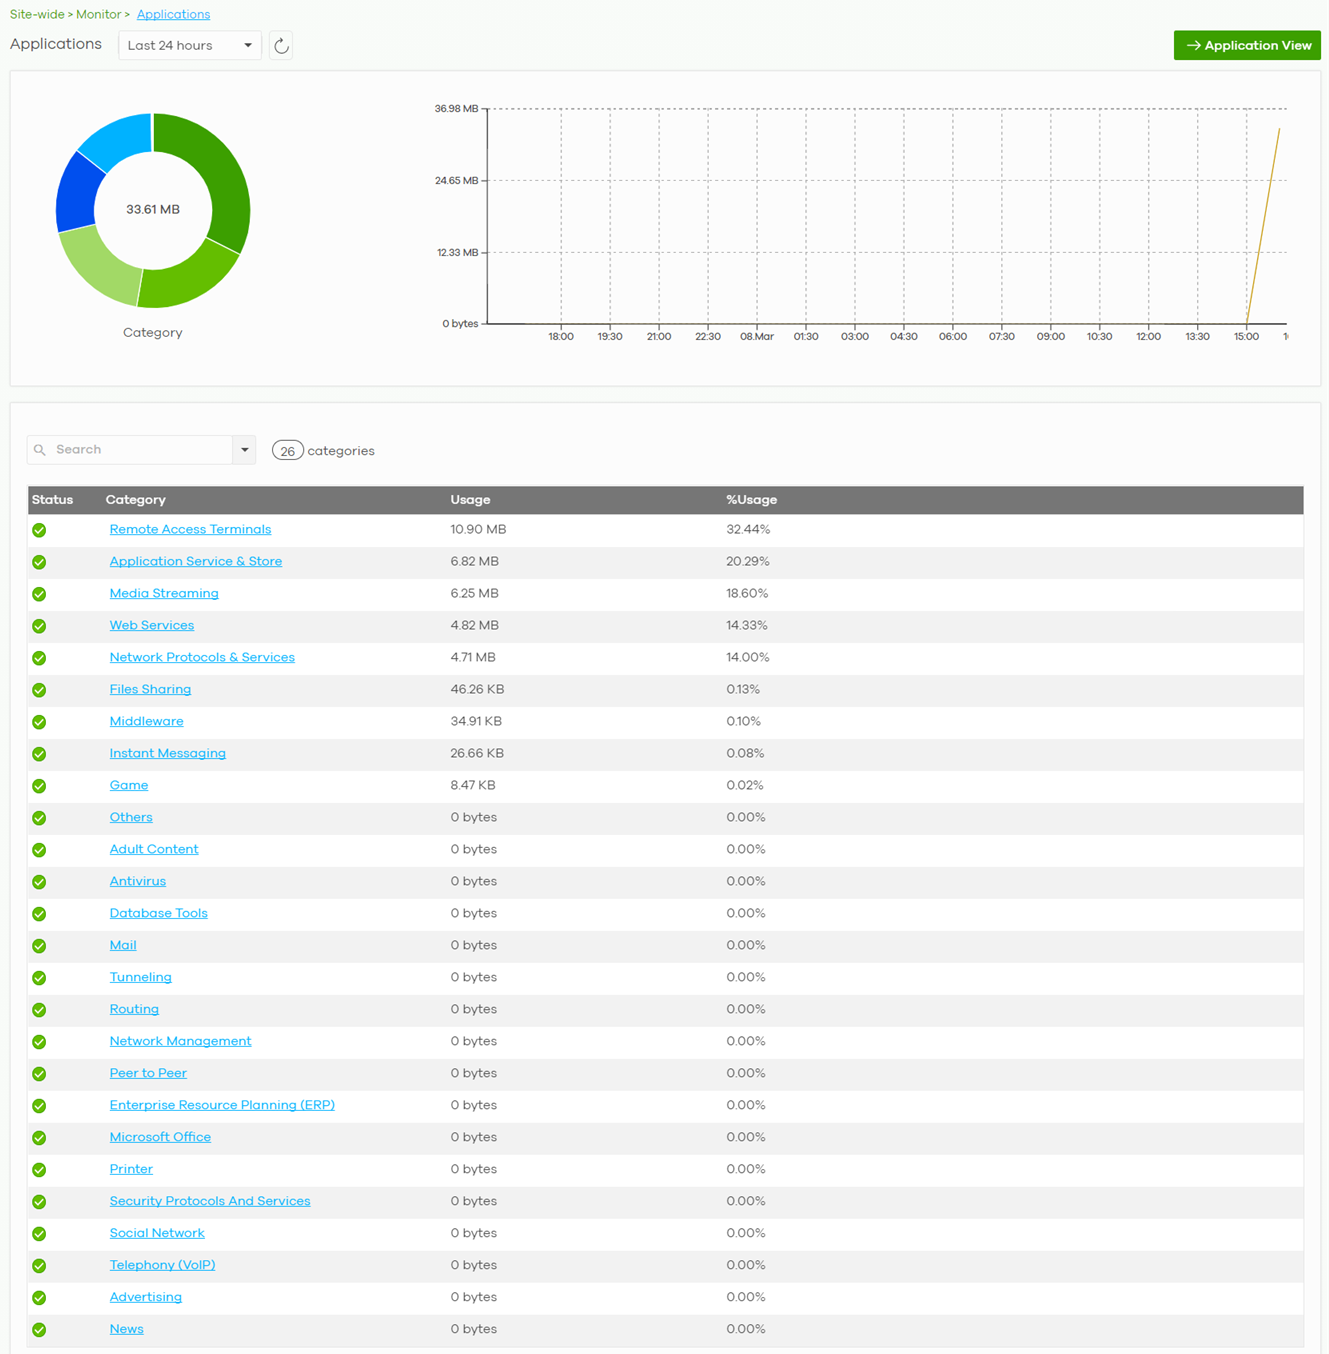
The following table describes the labels in this screen.
Label | Description |
|---|---|
Applications | In Application view, select to view all applications, or only applications with bandwidth or block policies applied. Select to view the report for the past day, week or month. Alternatively, select Custom range... to specify a time period the report will span. You can also select the number of results you want to view in a table. |
Click this button to reload the data-related frames on this page. | |
Category View / Application View | Click this button to view statistics by application or category. |
y-axis | The y-axis shows the total amount of data used by applications or categories in the site. |
x-axis | The x-axis shows the time period over which the data usage occurred. |
Keyword | Enter a keyword to filter the list of log entries. |
Status | This shows whether the application or category is blocked or allowed within the current site. |
Category | This shows the name of the category to which the application belongs. |
Usage | This shows the amount of data consumed by the application, or all applications in the category. |
% Usage | This shows the percentage of usage for the application or category. |
Block / Unblock | Blocks or unblocks the application or application category on the site’s gateway. |
Application-View Fields | |
Application | This shows the application name. |
Limited interface | This shows the site gateway’s interfaces that have bandwidth restriction policies for the application. |
Limit | Click this to limit the bandwidth for the application on the site’s gateway. You can apply the restrictions per gateway interface, or for all interfaces. |
Configure
Use the Configure menus to set the general and email alert settings for the selected site, or register a new Nebula Device and assign it to the site.
General Settings
Use this screen to change the general settings for the site, such as the site name, Nebula Device login password and firmware upgrade schedule. Click Site-Wide > Configure > General Settings to access this screen.
Site-Wide > Configure > General settings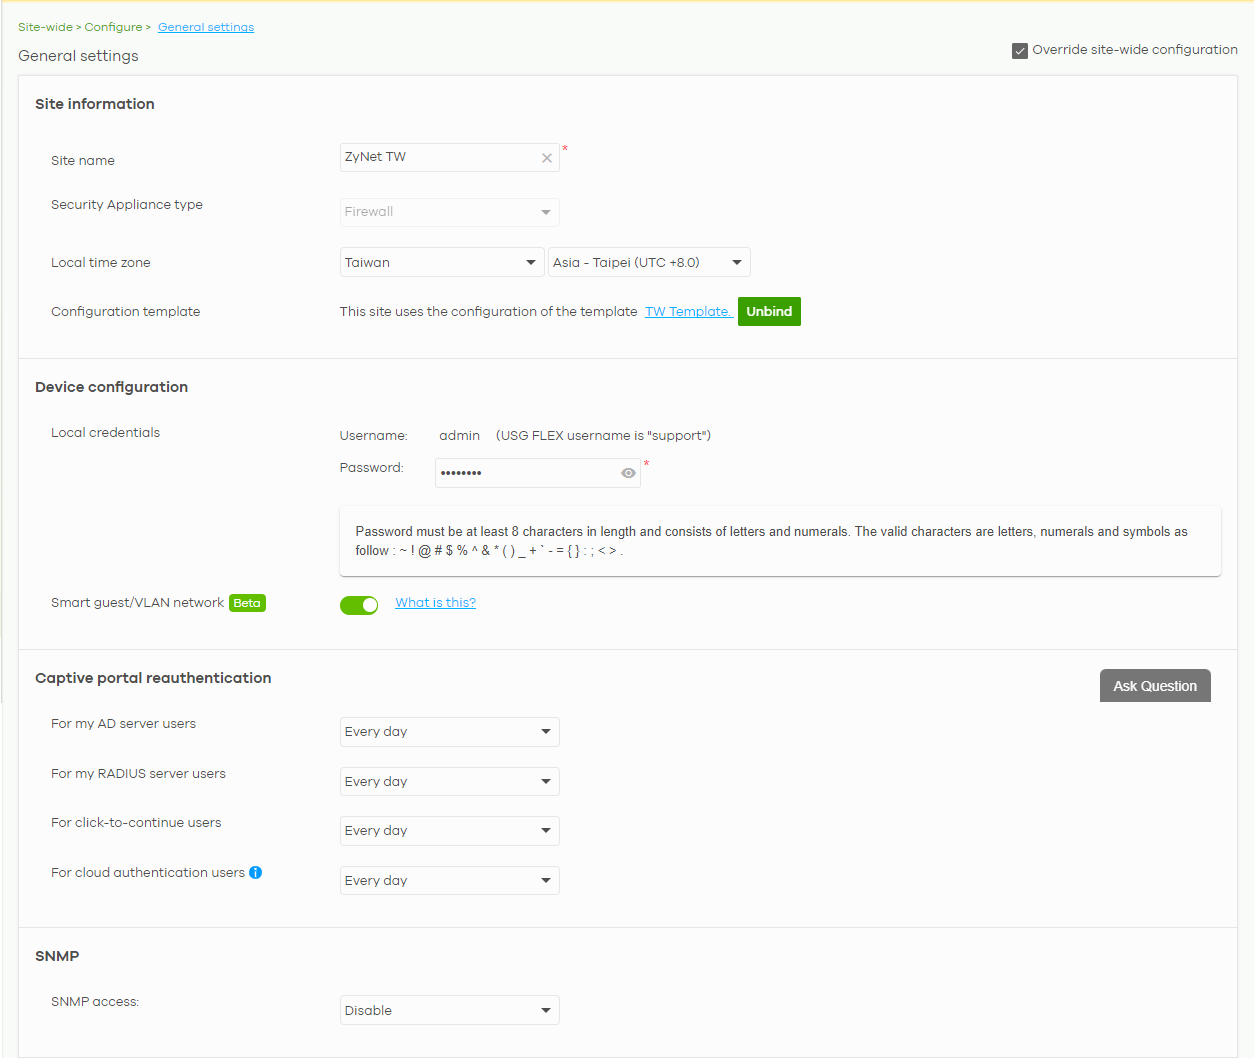
The following table describes the labels in this screen.
Label | Description |
|---|---|
Site Information | |
Site name | Enter a descriptive name for the site. |
Security Appliance type | Click this to select whether the sites will contain a ZyWALL USG FLEX, ATP, USG20W-VPN, or NSG device as its Security Gateway. This choice changes which settings are available within the site, and changes the gateway menu between Security Gateway and Firewall. If you have added a Security Gateway device to the site, then this field is set automatically and cannot be edited. This shows Firewall if the site contains an ZyWALL USG FLEX, ATP, or USG20W-VPN device. Otherwise, this shows Security Gateway if the site contains an NSG device. |
Local time zone | Choose the time zone of the site’s location. |
Configuration template | The name of the template that the site is bound to is shown here. Click Unbind to release the site from using the configuration template. The site which is unbound from the template still retains the settings applied from the template. |
Device configuration | |
Local credentials | The default password is generated automatically by the NCC when the site is created. You can specify a new password to access the status page of the Nebula Device’s built-in web-based configurator. The settings here apply to all Nebula Devices in this site. |
Smart guest/VLAN network | Click On to enable this feature. This allows the NCC to check if the VLAN ID and guest network settings are consistent on the APs and security gateway in the same site to ensure guest network connectivity. The guest settings you configure for a gateway interface (in Security Gateway > Configure > Interfaces addressing) will also apply to the wireless networks (SSIDs) associated with the same VLAN ID (in AP > Configure > SSID overview). For example, if you set a gateway interface in VLAN 100 as a guest interface, the SSID that belongs to VLAN 100 will also act as a guest network. |
Captive portal reauthentication | |
For my AD server users | Select how often the user (authenticated by an AD server) has to log in again. |
For my RADIUS server users | Select how often the user (authenticated by a RADIUS server) has to log in again. |
For click-to-continue users | Select how often the user (authenticated through the captive portal) has to log in again. |
For cloud authentication users | Select how often the user (authenticated using the NCC user database) has to log in again. |
SNMP | |
SNMP access | Select V1/V2c to allow SNMP managers using SNMP to access the Nebula Devices in this site. Otherwise, select Disable. |
SNMP community string | This field is available when you select V1/V2c. Enter the password for the incoming SNMP requests from the management station. |
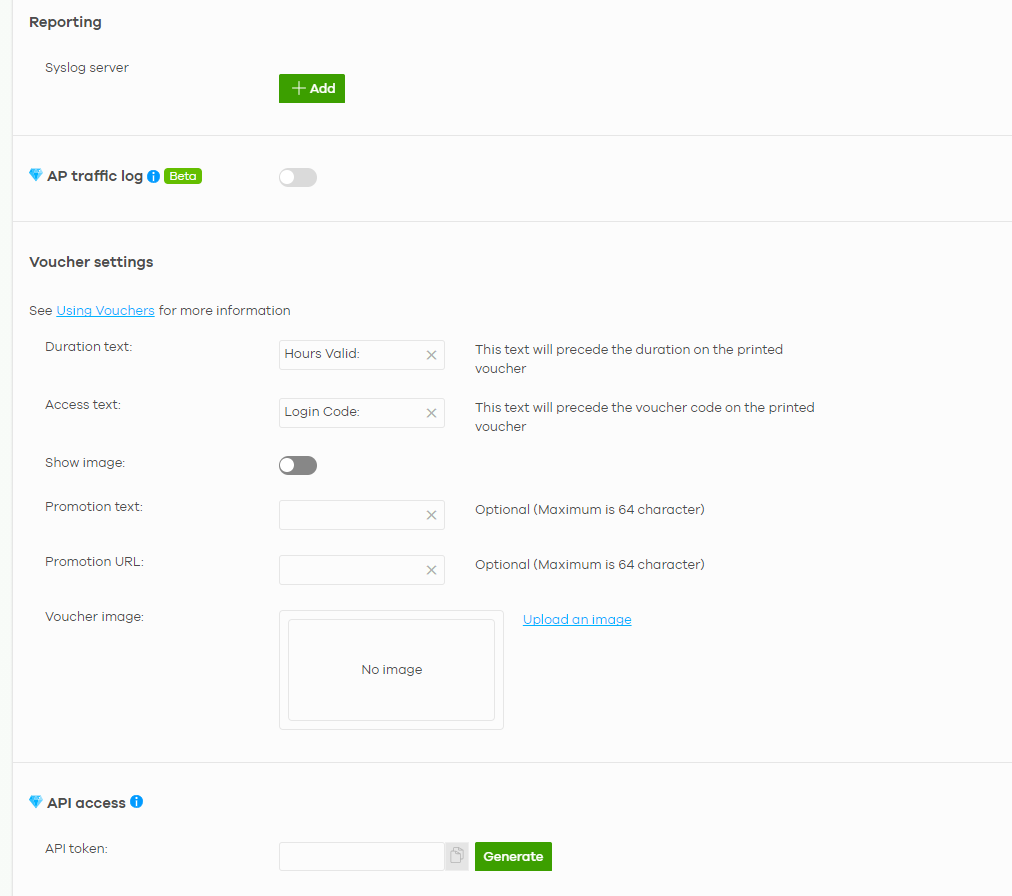
Reporting | |
Syslog server | Click Add to create a new entry. |
Server IP | Enter the IP address of the server. |
Types | Select the type of logs the server is for. |
Action | Click the Delete icon to remove the entry. |
AP traffic log | Log traffic for APs in the site that have NAT Mode set to Use Zyxel DHCP & NAT. You can also send the logs to a Syslog server, by selecting AP traffic log under Syslog server > Types. For details on configuring NAT Mode, see SSID Settings. |
Voucher settings | Use these settings to configure how WiFi network authentication vouchers for this site look when printed. 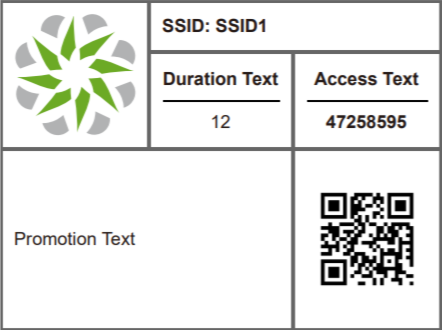 For more information on vouchers, see Vouchers. |
Duration test | Sets the text that proceeds the duration on the voucher. The text must consist of 1 – 16 characters. |
Access text | Sets the text that proceeds the access code on the voucher. The text must consist of 1 – 16 characters. |
Show image | Sets whether to display an image at the top-left of the voucher. This image is optional. |
Promotion text | Sets the promotional text on the voucher. This text is optional. The text must consist of 1 – 64 characters. |
Promotion URL | Sets the promotional URL on the voucher. This URL is optional. The URL is displayed as a QR Code on the voucher. |
Voucher image | This shows the uploaded image that will be displayed at the top-left of the voucher. |
Upload an image | Click this button to upload an image from your local computer. The Choose File button appears. Click this button to locate the PNG (preferred for its transparency) / JPEG/GIF image file. The maximum image file size is 200 KB. |
Replace this image | Click this button to change the uploaded image. |
Remove this image | Click this button to delete the uploaded image. |
API access | API access allows third-party software to integrate with the DPPSK feature in NCC. For more information, please contact Zyxel. |
API token | Generate an API token for DPPSK third-party integration. |
Generate | Click this button to create a new API key. |
Copy | Click this button to copy the API key to the system’s clipboard. |
Delete | Click this button to delete the API key. |
Collaborative Detection & Response
Collaborative Detection & Response (CDR) allows you to detect wired and WiFi clients that are sending malicious traffic in your network and then block or quarantine traffic coming from them. In this way, malicious traffic is not spread throughout the network. Secure policies can block malicious traffic for specific traffic flows, but CDR can block malicious traffic from the sender. Malicious traffic is identified using a combination of Web Filtering, Anti-Malware and IPS (IDP) signatures.
Site-Wide > Configure > Collaborative Detection & Response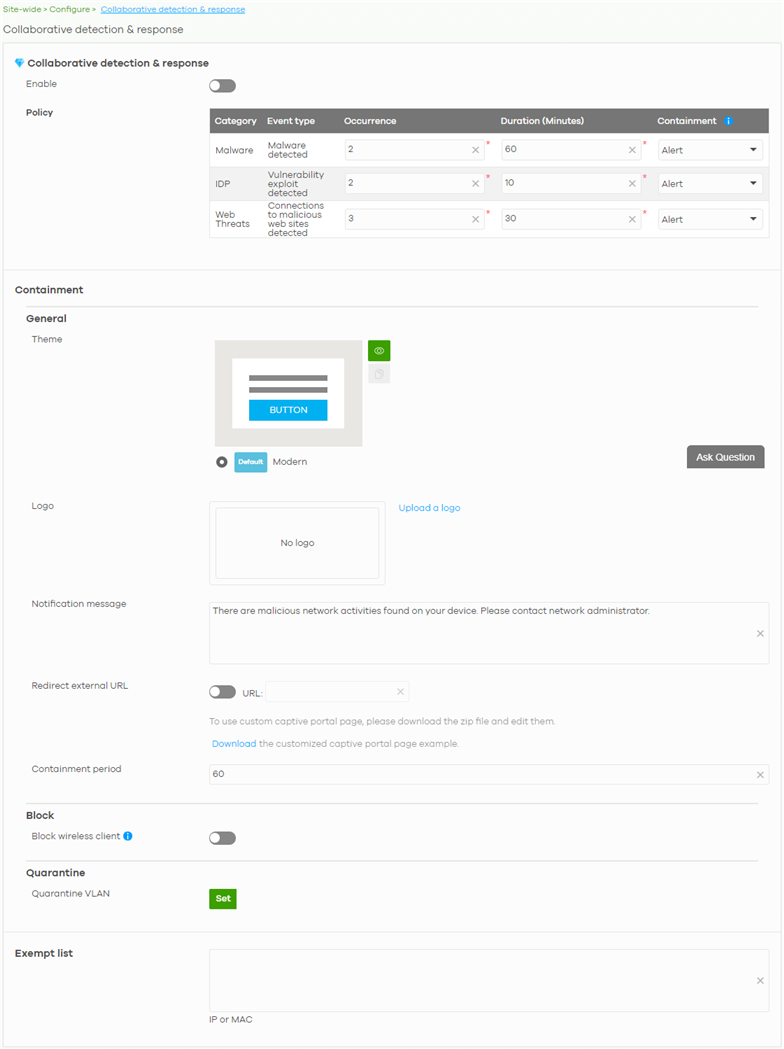
The following table describes the labels in this screen.
Label | Description |
|---|---|
Collaborative detection & response | |
Enable | Select this check box to activate Collaborative Detection & Response. Make sure you have active Web Filtering, Anti-Malware, IPS (Intrusion Prevention System), and CDR (Collaborative Detection & Response) licenses. |
Policy | |
Category | Category refers to the signature type that identified the malicious traffic: Malware (Anti-Malware, Anti-Virus), IDP (IPS), and Web Threat (Content Filtering and URL Threat Filtering). |
Event Type | This displays some details on the category of malicious traffic detected. |
Occurrence (1–100) | Enter the number of security events that need to occur within the defined Duration to trigger a CDR Containment action. |
Duration (1–1440) | Enter the length of time in minutes the event should occur from a client the Occurrence number of times to trigger a CDR Containment action. For example, Occurrence is set to 10, and Duration is set to 100. If the NCC detects 10 or more occurrences of malicious traffic in less than 100 minutes, then CDR Containment is triggered. |
Containment | Select the action to be taken when the number of security events exceed the threshold within the defined duration. Alert: Select this if you just want to issue a notification in NCC. Block: Select this if you want to block traffic from a suspect client at the NCC, or from a suspect WiFi client at the AP connected to the NCC. Traffic is still broadcast to other clients in the same subnet. A ‘notification’ web page is displayed when this action is triggered. Quarantine: Select this if you want to isolate traffic from a suspect client at the NCC in a quarantine VLAN. Traffic is not broadcast to other clients in the same subnet. A ‘notification’ web page is displayed to the client when this action is triggered. |
Containment | Use this section to configure the selection containment action. |
General | |
Theme | Configure the CDR block page. • Click the Preview icon at the upper right corner of a theme image to display the block page in a new frame. • Click the Copy icon to create a new custom theme (block page). |
Logo | This shows the logo image that you uploaded for the customized block page. Click Choose File and specify the location and file name of the logo graphic or click Browse to locate it. You can use the following image file formats: GIF, PNG, or JPG. File size must be less than 200 KB, and images larger than 244 x 190 will be resized. |
Notification message | Enter the message that is displayed on the CDR block page. The client is redirected here when a Block or Quarantine action is triggered. For example, “Malicious traffic is coming from your device so traffic is temporarily stopped. Please contact the network administrator.” Redirect external URL: Type a URL in “http://domain” or “https://domain” format to an external notification page. The client is redirected here when a Block or Quarantine action is triggered. Make sure the external notification page is accessible from the NCC. |
Redirect external URL | Enable this setting, and then enter a URL in “http://domain” or “https://domain” format to an external notification page. The client is redirected to this page when a Block or Quarantine action is triggered. You can download a sample block page by clicking Download. |
Containment Period | Enter how long the client should be blocked or quarantined. This should be at least twice the DHCP server lease time in order to prevent false positives. |
Block | Enter how long a suspect client should be blocked or quarantined. You can enter from 1 minute to 1 day (1,440 minutes). 0 means the suspect is blocked forever until released in Monitor > CDR > Containment List. |
Block wireless client | Select this to have traffic from the suspect client blocked at the AP. Clear this to have traffic from the suspect client blocked at the NCC. |
Quarantine | |
Quarantine VLAN | Click Set to configure a VLAN in order to isolate traffic from suspect clients. Traffic from a suspect client is broadcast to all members in the VLAN. |
Exempt list | Enter IPv4 and /or MAC addresses of Nebula Devices that are exempt from CDR checking. |
Quarantine Interface Configuration
Click Set at Site-Wide > Configure > Collaborative Detection & Response > Containment > Quarantine to configure the VLAN and interface used to isolate a client when a quarantine action is triggered. The following screen appears.
Note: Only IPv4 addresses can be used in quarantine VLANs.
Site-Wide > Configure > Collaborative Detection & Response > Quarantine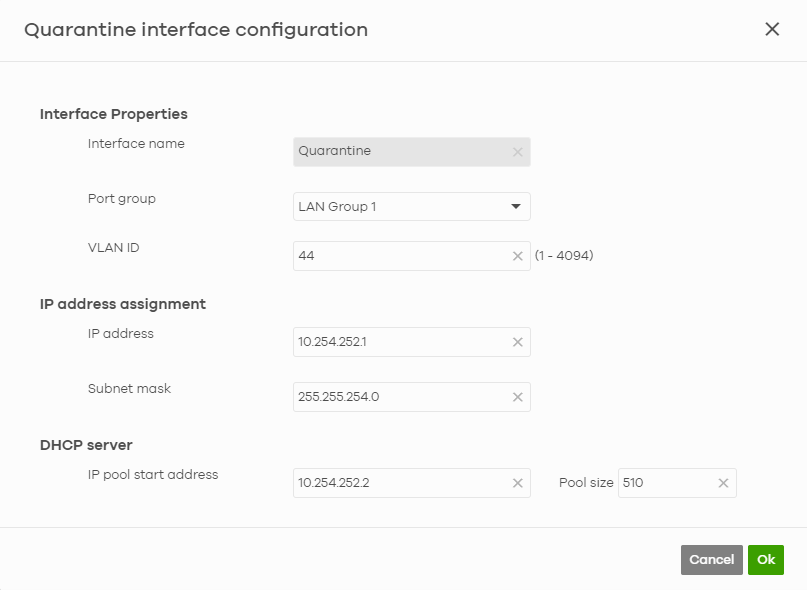
Each field is explained in the following table.
Label | Description |
|---|---|
Interface Properties | |
Interface Name | This field is read-only. The default name is “Quarantine”. |
Port group | Select the name of the port group to which you want the interface to belong. |
Base Port | Select the Ethernet interface on which the VLAN interface runs. |
VLAN ID | Enter the VLAN ID. This 12-bit number uniquely identifies each VLAN. Allowed values are 1 – 4094. (0 and 4095 are reserved.) |
IP address assignment | This is a 3-bit field within a 802.1Q VLAN tag that is used to prioritize associated outgoing VLAN traffic. . |
IP address | Enter the IP address for this interface. |
Subnet mask | Enter the subnet mask of this interface in dot decimal notation. The subnet mask indicates what part of the IP address is the same for all computers in the network. |
DHCP Server | |
Get Automatically | Enter the IP address from which the Security Gateway begins allocating IP addresses. If you want to assign a static IP address to a specific computer, click Add new under Static DHCP Table. |
IP pool start address | Enter the IP address from which the Security Gateway begins allocating IP addresses for this VLAN. |
Pool size | Enter the total number of IP addresses the DHCP server will hand out. |
OK | Click OK to save your changes back to the NCC. |
Cancel | Click Cancel to exit this screen without saving. |
Alert Settings
Use this screen to set which alerts and reports are created and emailed. You can also set the email addresses to which an alert is sent. Click Site-Wide > Configure > Alert Settings to access this screen.
Note: NCC’s Smart Alert Engine uses knowledge of network topology and cross-device functionality to only generate alerts for unexpected events. This helps avoids unnecessary emails and notifications.
For example, an AP is receiving power from a PoE switch. If the AP loses power because its Ethernet cable is disconnected, NCC generates an alert. If the AP loses power because the Switch has a PoE schedule that disables power to the AP, NCC does not generate an alert.
For example, an AP is receiving power from a PoE switch. If the AP loses power because its Ethernet cable is disconnected, NCC generates an alert. If the AP loses power because the Switch has a PoE schedule that disables power to the AP, NCC does not generate an alert.
Site-Wide > Configure > Alert settings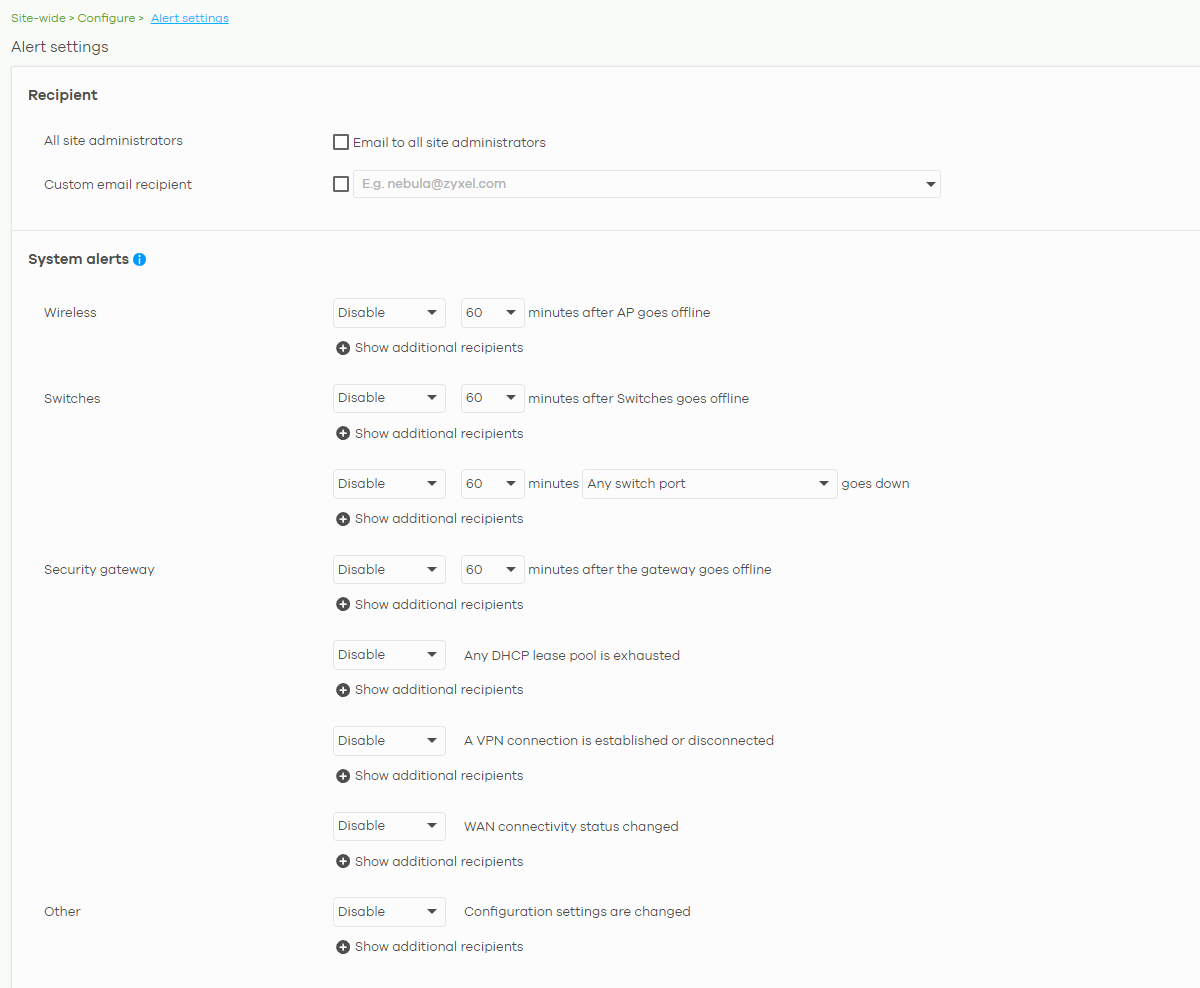
The following table describes the labels in this screen.
Label | Description |
|---|---|
Recipient | |
All site administrators | Select this to send alerts to all site administrators for the current site. |
Custom email addresses | Enter the email addresses to which you want to send alerts. |
Notification Type | For each alert, you can set how to receive alert notifications: • Email: Alert notifications are sent by email to configured administrators, custom email recipients, and additional recipients. • In-app Push: Alert notifications are sent to site administrators who are logged into the NCC mobile app. This type of notification is not available for some features. • Both: Alert notifications are sent by email and app notification. • Disabled: No alerts are sent. |
Show additional recipients | Add additional user accounts who will receive email and in-app notifications for the alert. |
System Alerts | |
Wireless | Specify how long in minutes the NCC waits before generating and sending an alert when an AP becomes offline. |
Switches | Specify how long in minutes the NCC waits before generating and sending an alert when a port or a Switch goes offline. |
Security gateway | Select the check box to have the NCC generate and send an alert by email when the following events occur: • A Security Gateway goes offline. • Any DHCP pool on the Security Gateway runs out of IP addresses. • A VPN connection to or from the Security Gateway is established or disconnected. • The WAN connectivity status changed. |
Other alerts | Specify whether to send an alert each time configuration settings are changed. |
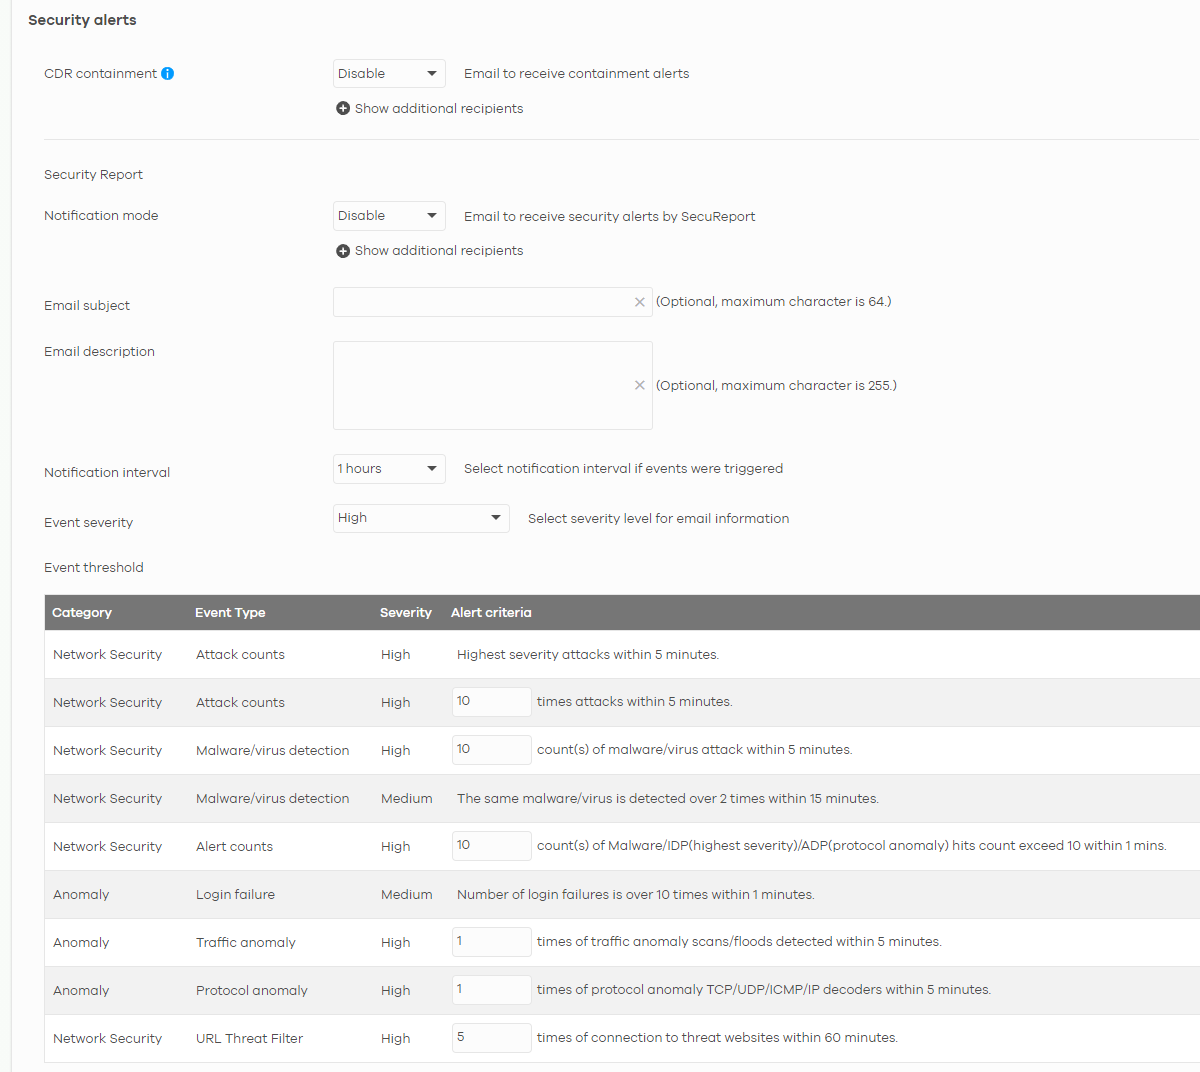
Security alerts | |
CDR containment | Specify whether to send an alert each time a CDR block or containment action is triggered. |
Security Report | |
Notification mode | Select whether to receive email security reports from SecuReporter. |
Notification interval | Specify how often to receive a SecuReporter report. If no security events were triggered, SecuReporter will not send a report. |
Event severity | Select the severity level of events that will be included in each report. |
Event threshold | This table lists the events that trigger SecuReporter security alerts. For some events, you can set the alert threshold. For example, X count(s) of malware/virus attack within 5 minutes means SecuReporter includes a report in the email if the total number of combined malware and virus detection events exceed X within a 5 minute time period. |
Add Devices
Use this screen to register a Nebula Device and add it to the site. Click Site-Wide > Configure > Add devices to access this screen.
Note: You have to contact Zyxel customer support if you need to change the Nebula Device owner at myZyxel or remove an Organization from the NCC. Please configure your Nebula Device owners and organizations carefully. See also License & Inventory.
Site-Wide > Configure > Add devices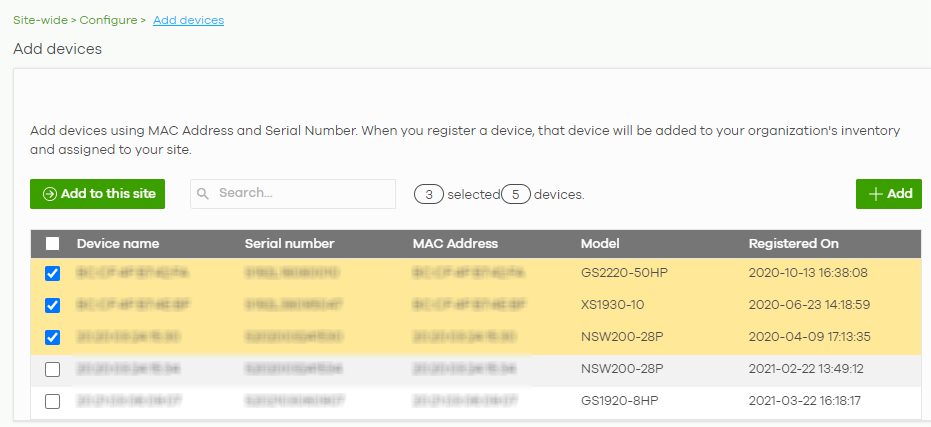
The following table describes the labels in this screen.
Label | Description |
|---|---|
Add to this site | Click this button to assign the selected Nebula Devices to the site. If you have selected a Security Firewall (see Supported Nebula Devices for a list of Security Firewalls), a pop-up window for you to select the deployment method appears. See Step 6: Set up the Deployment Method for more information. |
Search | Enter a keyword to filter the list of Nebula Devices by device name, serial number, MAC address, or model. |
N devices | This shows the number of registered Nebula Devices (N) which have not been assigned to a site. |
+ Add | This button is available only for an organization administrator or site administrator that has full access. Click this button to pop up a window where you can enter a Nebula Device’s serial number and MAC address to register it at the NCC. For details, see Add Devices Screen. |
Device name | This shows the descriptive name of the Nebula Device. |
Serial number | This shows the serial number of the Nebula Device. |
MAC address | This shows the MAC address of the Nebula Device. |
Model | This shows the model name of the Nebula Device. |
Registered On | This shows the time and date that the Nebula Device was added to NCC. |
Firmware Management
Use this screen to schedule a firmware upgrade. You can make different schedules for different types of Nebula Devices in the site or create a schedule for a specific Nebula Device. Click Site-Wide > Configure > Firmware management to access this screen.
Site-Wide > Configure > Firmware management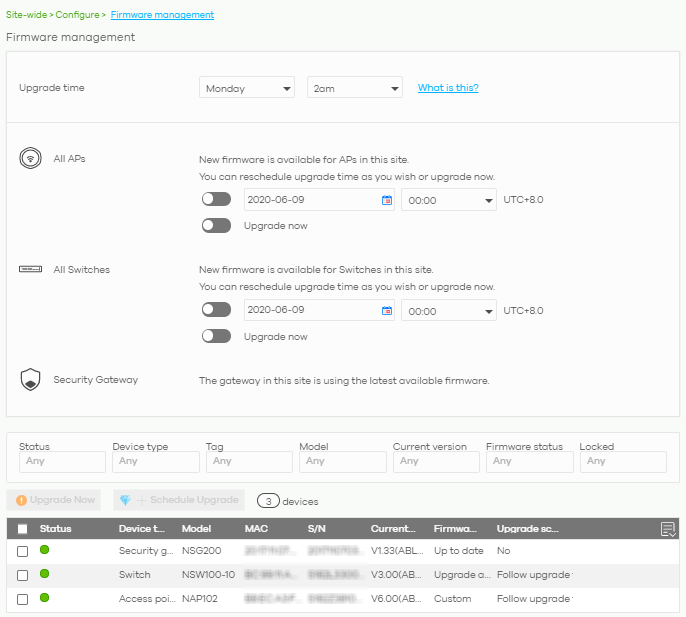
The following table describes the labels in this screen.
Label | Description |
|---|---|
Upgrade time | Select the day of the week and time of the day to install the firmware. The changes you make here also apply to the Site-Wide > Configure > General setting screen after you click Save. |
All APs | This section is grayed out if there is no AP in this site. Set a new schedule for the firmware upgrade and select On to enable the schedule. The changes you make here also apply to the Site-Wide > Configure > General setting screen after you click Save. |
All Switches | This section is grayed out if there is no Switch in this site. Set a new schedule for the firmware upgrade and select On to enable the schedule. The changes you make here also apply to the Site-Wide > Configure > General setting screen after you click Save. |
Security Gateway | This section is grayed out if there is no Security Gateway in this site. Set a new schedule for the firmware upgrade and select On to enable the schedule. The changes you make here also apply to the Site-Wide > Configure > General setting screen after you click Save. |
Status/Device Type/Tag/Model/Current Version/Firmware Status/Locked | Specify your desired filter criteria to filter the list of Nebula Devices. |
Upgrade Now | Click this to immediately install the firmware on the selected Nebula Devices. This button is selectable only when there is firmware update available for all the selected Nebula Devices. |
Schedule Upgrade | Click this to pop up a window where you can create a new schedule for the selected Nebula Devices. You can select to upgrade firmware according to the site-wide schedule configured for all Nebula Devices in the site, create a recurring schedule, or edit the schedule with a specific date and time when firmware update is available for all the selected Nebula Devices. With a recurring schedule, the NCC will check and perform a firmware update when a new firmware release is available for any of the selected Nebula Devices. If the NCC service is downgraded from Nebula Professional Pack to Nebula Base, the Nebula Devices automatically changes to adhere to the side-wide schedule. |
Status | This shows the status of the Nebula Device. • Green: The Nebula Device is on-line and has no alerts. • Amber: The Nebula Device has alerts. • Red: The Nebula Device is off-line. • Gray: The Nebula Device has been off-line for 7 days or more. |
Device Type | This shows the type of the Nebula Device. |
Model | This shows the model number of the Nebula Device. |
Tag | This shows the tag created and added to the Nebula Device. |
Name | This shows the descriptive name of the Nebula Device. |
MAC | This shows the MAC address of the Nebula Device. |
S/N | This shows the serial number of the Nebula Device. |
Current version | This shows the version number of the firmware the Nebula Device is currently running. It shows N/A when the Nebula Device goes off-line and its firmware version is not available. |
Firmware status | This shows whether the firmware on the Nebula Device is Up to date, there is firmware update available for the Nebula Device (Upgrade available), custom firmware was installed manually (Custom), a specific version of firmware has been installed by Zyxel customer support (Dedicated) or the Nebula Device goes off-line and its firmware status is not available (N/A). The status changes to Upgrading... after you click Upgrade Now to install the firmware immediately. |
Upgrade scheduled | This shows the date and time when a new firmware upgrade is scheduled to occur. Otherwise, it shows Follow upgrade time and the Nebula Device sticks to the site-wide schedule or No when the firmware on the Nebula Device is up-to-date or the Nebula Device goes off-line and its firmware status is not available. A lock icon displays if a specific schedule is created for the Nebula Device, which means the Nebula Device firmware will not be upgraded according to the schedule configured for all Nebula Devices in the site. |
Last upgrade time | This shows the last date and time the firmware was upgraded on the Nebula Device. |
Schedule upgrade version | This shows the version number of the firmware which is scheduled to be installed. |
Click this icon to display a greater or lesser number of configuration fields. |
Cloud Authentication
Use this screen to view and manage the user accounts which are authenticated using the NCC user database, rather than an external RADIUS server. Click Site-wide > Configure > Cloud Authentication to access these screen.
Note: The changes you made in this screen apply only to the current site. To change the cloud authentication settings for all sites in the organization, go to Organization-wide > Configure > Cloud Authentication (see Cloud Authentication).
Note: For more information on user account types, see User Account Types.
Cloud Authentication User Screen
Use this screen to view and manage regular NCC network user accounts. Click Site-wide > Configure > Cloud Authentication > User to access these screen.
Site-wide > Configure > Cloud Authentication > User
The following table describes the labels in this screen.
Note: Some of the actions on this screen are only available if your administrator account has full access to the organization.
Label | Description |
|---|---|
Authorization | Select one or more than one user account and click this button to configure the authorization settings for the selected user accounts. |
Remove users | Select one or more than one user account and click this button to remove the selected user accounts. |
VPN access | Select one or more than one user account and click this button to configure whether the accounts can be used to connect to the organization’s networks through VPN. |
VLAN attribute | Select one or more than one user account and click this button to assign the users to a specific VLAN ID, or clear the VLAN ID. Then click Update. 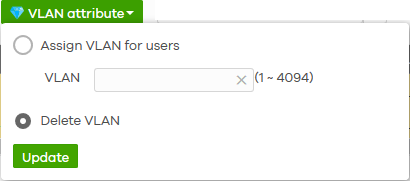 |
Print | Click this button to print information about each selected user account, such as their user name and password. |
Search users | Enter a key word as the filter criteria to filter the list of user accounts. |
N User | This shows how many user accounts (N) match the filter criteria and how many user accounts of the selected type are created in total. |
Import | Click this button to create user accounts in bulk by importing a complete list of all new users in an Excel file. |
Add | Click this button to create a new user account. See Cloud Authentication MAC Screen. |
Export | Click this button to save the account list as a CSV or XML file to your computer. |
Email | This shows the email address of the user account. |
Username | This shows the user name of the user account. |
Description | This shows the descriptive name of the user account. |
802.1X | This shows whether 802.1X (WPA-Enterprise) authentication is enabled on the account. |
VPN access | This shows whether the accounts can be used to connect to the organization’s networks through VPN. |
Authorized | This shows whether the user has been authorized in this site or not. |
Expire in (UTC) | This shows the date and time that the account expires. This shows -- if authentication is disabled for this account. This shows Never if the account never expires. This shows Multiple value if the account has different Expire in values across different sites. |
Login by | This shows whether the user needs to log in with the email address and/or user name. |
DPPSK | This shows the account’s dynamic personal pre-shared key (DPPSK), if one is set. |
VLAN assignment | This field is available only when the account type is set to User. This shows the VLAN assigned to the user. |
2FA Status | This shows whether the account has set up two-factor authentication yet. |
Bypass 2FA | This shows whether the account is allowed to bypass two-factor authentication, if two-factor authentication is enabled on a captive portal or VPN gateway. |
Authorized by | This shows the email address of the administrator account that authorized the user. If the account has been authorized by different administrators across different sites, it shows Multiple value. |
Created by | This shows the email address of the administrator account that created the user. |
Created at | This shows the date and time that the account was created. |
Click this icon to display a greater or lesser number of configuration fields. |
Cloud Authentication MAC Screen
Use this screen to view and manage Nebula Device user accounts, used for MAC-based authorization. Click Site-wide > Configure > Cloud Authentication > MAC to access this screen.
Site-wide > Configure > Cloud Authentication > MAC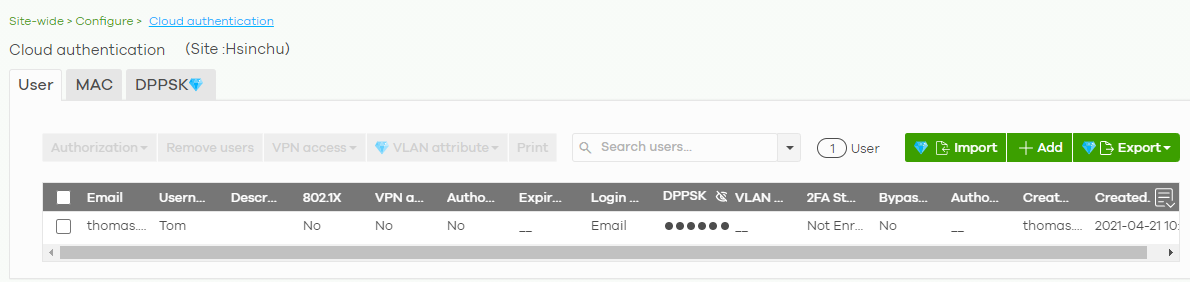
The following table describes the labels in this screen.
Note: Some of the actions on this screen are only available if your administrator account has full access to the organization.
Label | Description |
|---|---|
Authorization | Select one or more than one account and click this button to configure the authorization settings for the selected user accounts. |
Remove users | Select one or more than one user account and click this button to remove the selected user accounts. |
Search users | Enter a key word as the filter criteria to filter the list of user accounts. |
N User | This shows how many user accounts (N) match the filter criteria and how many user accounts of the selected type are created in total. |
Import | Click this button to create user accounts in bulk by importing a complete list of all new users in an Excel file. |
Add | Click this button to create a new user account. See Cloud Authentication DPPSK Screen. |
Export | Click this button to save the account list as a CSV or XML file to your computer. |
Email | This shows the email address of the user account. |
MAC address | This shows the MAC address of the user account. |
Description | This shows the descriptive name of the user account. |
Account type | This shows this type of user account: USER, MAC, or DPPSK. |
Authorized | This shows whether the user has been authorized in this site or not. |
Authorized by | This shows the email address of the administrator account that authorized the user. If the account has been authorized by different administrators across different sites, it shows Multiple value. |
Expire in (UTC) | This shows the date and time that the account expires. This shows -- if authentication is disabled for this account. This shows Never if the account never expires. This shows Multiple value if the account has different Expire in values across different sites. |
Created at | This shows the date and time that the account was created. |
Click this icon to display a greater or lesser number of configuration fields. |
Cloud Authentication DPPSK Screen
Use this screen to view and manage DPPSK network user accounts. Click Site-wide > Configure > Cloud Authentication > DPPSK to access this screen.
Site-wide > Configure > Cloud Authentication > DPPSK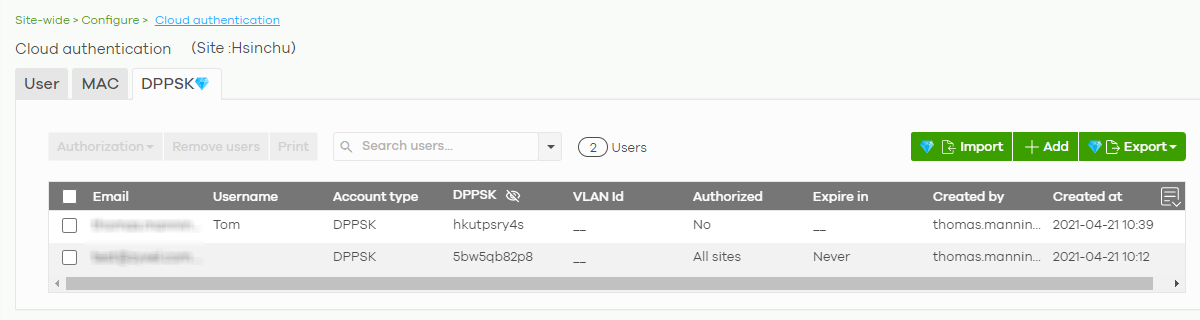
The following table describes the labels in this screen.
Label | Description |
|---|---|
Authorization | Select one or more than one user account and click this button to configure the authorization settings for the selected user accounts. |
Remove users | Select one or more than one user account and click this button to remove the selected user accounts. |
Print | Click this button to print the unique dynamic personal pre-shared key (DPPSK) and expiry time of each selected user account. The account details can be cut into cards, and then given to users in order to grant them wireless network access.  |
Search users | Enter a key word as the filter criteria to filter the list of user accounts. |
N Users | This shows how many user accounts (N) match the filter criteria and how many user accounts of the selected type are created in total. |
Import | Click this button to create user accounts in bulk by importing a complete list of all new users in an Excel file. |
Add | Click this button to create a single new account, or a batch of accounts. • Single DPPSK: See Add/Edit DPPSK Account. • Batch create DPPSK: See Batch Create DPPSK Accounts. |
Export | Click this button to save the account list as a CSV or XML file to your computer. |
Email | This shows the email address of the user account. |
Username | This shows the user name of the user account. |
Account type | This shows the type of user account: USER, MAC, or DPPSK. |
DPPSK | This shows the account’s dynamic personal pre-shared key (DPPSK). |
VLAN ID | This shows the VLAN assigned to the account. |
Description | This shows the descriptive name of the user account. |
Authorized | This shows whether the user has been authorized in this site or not. |
Expire in (UTC) | This shows the date and time that the account expires. This shows -- if authentication is disabled for this account. This shows Never if the account never expires. This shows Multiple value if the account has different Expire in values across different sites. |
Created by | This shows the email address of the administrator account that created the user. |
Created at | This shows the date and time that the account was created. |
Click this icon to display a greater or lesser number of configuration fields. |