Clients
This screen shows a list of all wired and WiFi clients connected to Nebula Devices (access points, Switches, Security Appliances, mobile routers) in the site. You can also block or allow clients. Click Site-wide > Clients to access this screen.
Site-wide > Clients > Client list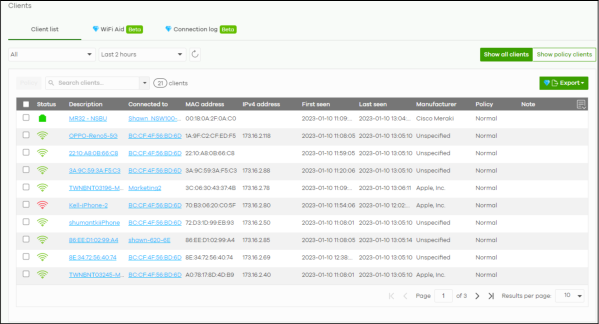
The following table describes the labels in this screen.
Label | Description |
|---|---|
Client list | Select to filter the list of clients, based on what type of Nebula Device (access point, Switch, Security Appliance, mobile router) the client is connected to. You can also set a time; the list shows each client’s connection status in the past two hours or past 24 hours. |
Click this button to reload the data-related frames on this page. | |
Show all clients | Click this to show all clients that have been online during the selected time period. |
Show policy clients | Click this to show clients that have a white-listed or blocked policy applied to them, regardless of when they were last online. The client’s usage data is calculated according to the selected time period. |
Policy | Select the clients from the table below, and then choose the security policy that you want to apply to the selected clients. Choose one of the following policies, then click Apply policy. • Allow list: The selected clients to bypass captive portal authentication. • Block list: The selected clients cannot connect to the site. How a client is blocked depends on the connected Nebula Device type selected under Client list. AP: The client is blocked by MAC address from connecting to any AP in the site. Switch: The client is blocked by MAC address from sending or receiving network traffic. Gateway: The Security Appliance will not route traffic for the client’s IP address. • To specific SSID: Selectively apply captive portal authentication to specific SSIDs on an AP. • Normal: The selected clients have no policies applied to them. |
Search clients | Specify your desired filter criteria to filter the list of clients. |
N clients | This shows the number of clients (N) connected to the gateway in the site network. |
Export | Click this button to save the client list as a CSV or XML file to your computer. |
General fields | |
Select an entry’s check box to select a specific client. Otherwise, select the check box in the table heading row to select all clients. | |
Status | This shows whether the client is online (green) or offline (red), and whether the client is wired or wireless. • Clients connected to an Access Point are reported as wireless. • Clients connected to a Switch or Security Appliance are reported as wired. |
Description | This shows the descriptive name of the client. By default, this is the client’s MAC address. The client description can be obtained through the following: • User customized description • Hostname detected from client’s LLDP (Link Layer Discovery Protocol) System Name • Hostname detected from the Nebula-managed access point • Hostname detected from the Nebula-managed Security Appliance. Click the name to display the individual client statistics. See wireless: WiFi Client Details and wired: Wired Client Details. |
Connected to | This shows the name of the Nebula Device to which the client is connected in this site. Click the Nebula Device name to display the screen where you can view detailed information about the Nebula Device. |
MAC address | This shows the MAC address of the client. Click the MAC address to display the individual client statistics. See wireless: WiFi Client Details and wired: Wired Client Details. |
IPv4 address | This shows the IPv4 address of the client. By default, the field is blank. The client IPv4 address can be obtained through the following: • IPv4 address detected from client’s LLDP (Link Layer Discovery Protocol) Management Address • IPv4 address detected from the Nebula-managed access point • IPv4 address detected from the Nebula-managed Security Appliance. |
First seen | This shows the first date and time the client was discovered over the specified period of time. |
Last seen | This shows the last date and time the client was discovered over the specified period of time. |
Manufacturer | This shows the manufacturer of the client hardware. |
Policy | This shows the security policy applied to the client. |
Note | This shows additional information about the client. |
Click this icon to display a greater or lesser number of configuration fields. | |
WiFi Client Details
Click a WiFi client entry in the Site-wide > Clients > Clients list screen to display individual client statistics.
Site-wide > Clients > Clients list: WiFi Client Details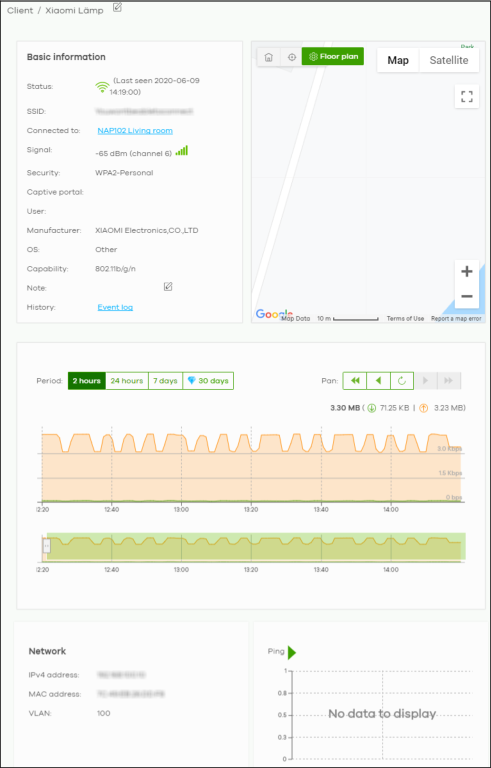
The following table describes the labels in this screen.
Label | Description |
|---|---|
Client | Click the edit icon to change the client name. |
Status | This shows whether the client is online (green), or goes offline (red). It also shows the last date and time the client was discovered. |
SSID | This shows the name of the Access Point’s WiFi network to which the client is connected. |
Connected to | This shows the name of the Nebula managed Access Point to which the client is connected. Click the name to display the individual Access Point statistics. See Access Point Details. |
Signal | This shows the RSSI (Received Signal Strength Indicator) of the client’s WiFi connection, and an icon showing the signal strength. Icon default thresholds: • Green/5 blocks: signal is greater than –67 dBm, strong signal • Amber/4 blocks: signal –67 to –73 dBm, average signal • Amber/3 blocks: signal –74 to –80 dBm, below average signal • Red/2 blocks: signal is less than –80 dBm, weak signal |
Security | This shows the encryption method used to connect to the Access Point. |
Captive portal | This shows the web authentication method used by the client to access the network. |
User | This shows the number of users currently connected to the network through the client device. |
Manufacturer | This shows the manufacturer of the device connected to the Access Point. |
OS | This shows the operating system running on the client device, if known. |
Capability | This shows the WiFi standards supported by the client or the supported standards currently being used by the client. |
Note | This shows additional information for the client. Click the edit icon to change it. |
History | Click Event log to go to the Site-wide > Monitor > Access points > Event log screen. |
Map | This shows the location of the client on the Google map. |
Period | Select to view the statistics in the past two hours, day, week or month. |
Pan | Click to move backward or forward by two hours or one day. |
y-axis | The y-axis shows the transmission speed of data sent or received by the client in kilobits per second (Kbps). |
x-axis | The x-axis shows the time period over which the traffic flow occurred. |
Network | |
IPv4 address | This shows the IP address of the client. |
MAC address | This shows the MAC address of the client. |
VLAN | This shows the ID number of the VLAN to which the client belongs. |
Ping | Click the button to ping the client’s IP address from the Nebula AP to test connectivity. |
Loss rate | This shows the rate of packet loss when you perform ping. |
Average latency | This shows the average latency in ms when you perform ping. |
Wired Client Details
Click a wired client’s descriptive name in the Site-wide > Clients > Clients list screen to display individual client statistics.
Site-wide > Clients > Clients list: Wired Client Details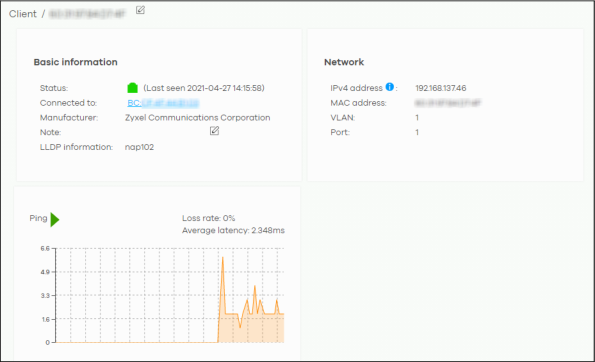
The following table describes the labels in this screen.
Label | Description |
|---|---|
Client | Click the edit icon to change the client name. |
Status | This shows whether the client is online (green) or offline (red). It also shows the last date and time the client was discovered, and whether the client is wired or wireless. |
Connected to | This shows the name of the Security Appliance to which the client is connected. |
Manufacturer | This shows the manufacturer of the client device. |
Note | Enter information about this Nebula Device, for yourself or for other administrators. |
LLDP information | This shows the LLDP (Link Layer Discovery Protocol) information received from the remote device. |
Network | |
IPv4 address | This shows the IPv4 address of the client. |
MAC address | This shows the MAC address of the client. |
VLAN | This shows the VLAN ID for this client. |
Port | This shows the port number of the Nebula Device the client is connected. |
Ping | Click the button to ping the client’s IP address from the gateway to test connectivity. |
WiFi Aid
The WiFi Aid screen displays the number of WiFi clients that cannot connect to an AP(s) in a site. It also displays the number of WiFi clients who cannot authenticate in a hotspot (captive portal) or who have timed out.
Use this screen to identify connection problems between WiFi clients and supported AP(s). Click Site-wide > Clients > WiFi Aid to access this screen.
Site-wide > Clients > WiFi Aid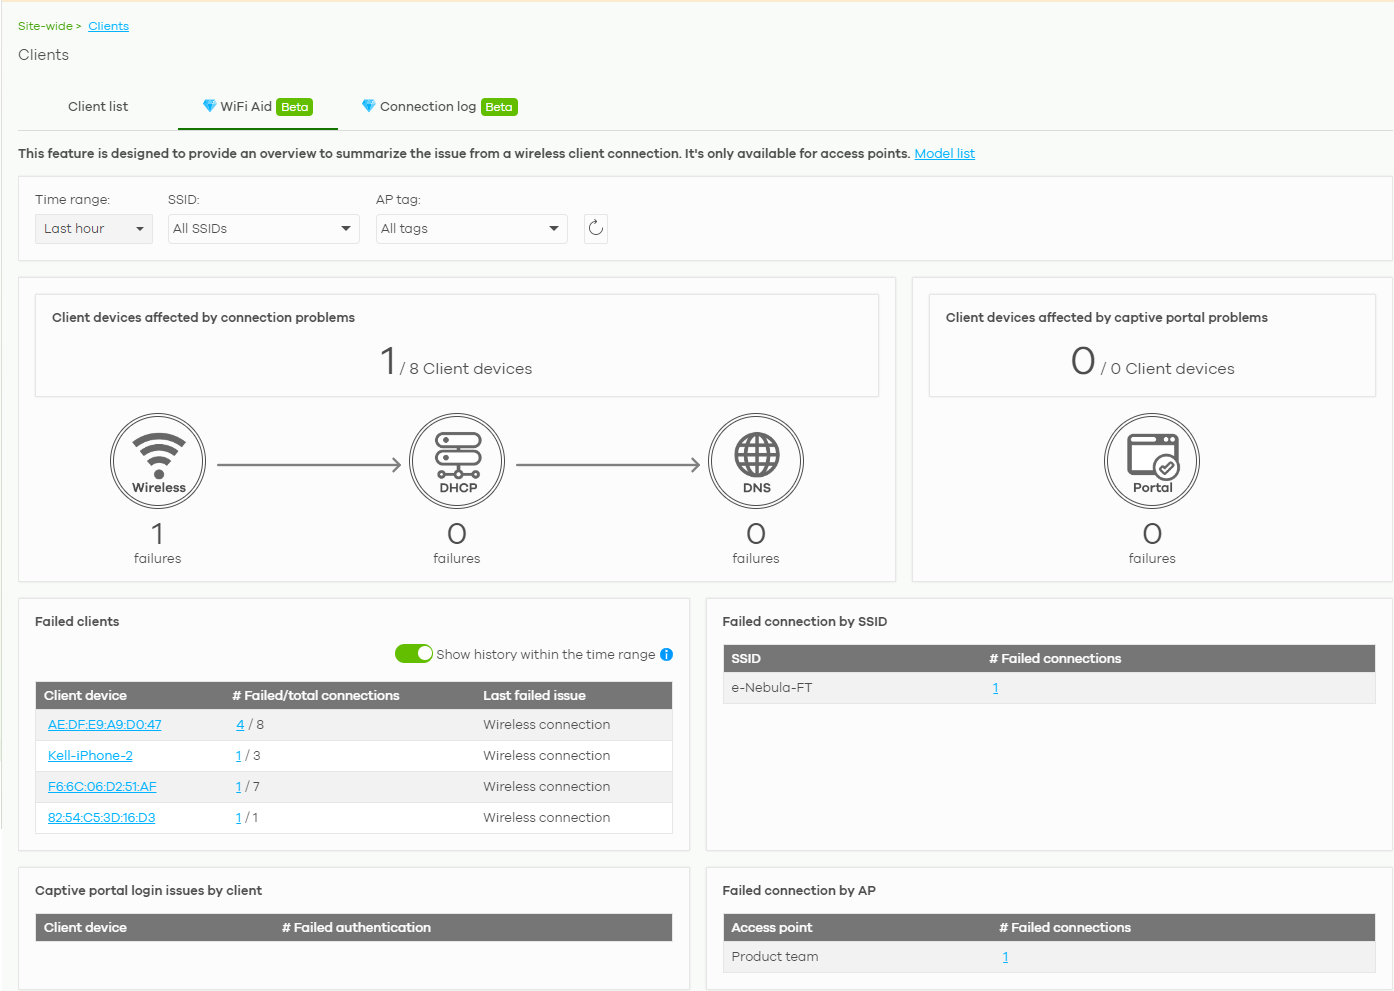
The following table describes the labels in this screen.
Label | Description |
|---|---|
WiFi Aid | Select a Time range. The overview will show all WiFi clients’ connection issues in the Last hour, Last 12 hours, Last 24 hours, or Custom range (from 15 minutes to one day). Select to filter the overview of the client’s WiFi connection issues based on one AP WiFi network (SSID), or all WiFi networks (All SSIDs, default). Select to filter the overview of all WiFi clients’ connection issues based on one AP tag, or All tags (default). This is the tag you create in Access point > Monitor > Access points. Click the Refresh icon to update this screen. |
Client devices affected by connection problems | This chart displays the number of WiFi clients with the following connection problems. • Wireless failures. This displays the number of WiFi clients that failed association to an AP or failed authentication. • DHCP failures. This displays the number of WiFi clients that failed to receive an IP address due to DHCP failure/timeout with the DHCP server. • DNS failures. This displays the number of WiFi clients that failed DNS query due to DNS timeout from a DNS server. |
Client devices affected by captive portal problems | This chart displays the number of WiFi clients that failed hotspot authentication. This includes entering the wrong user credentials or an authentication timeout. |
Failed clients | This table displays the number of WiFi clients with failed connection attempts (WiFi connection/DHCP client/DNS failures – numerator) over the number of total connection attempts (denominator). The list displays the WiFi client with the most connection failures first, in descending order. Clicking the hyperlink in the Client device column will direct you to the Site-wide > Monitor > Client: Client device screen. See Clients for more information on this screen. Clicking the numerator hyperlink in the # Failed/total connections column will direct you to the Site-wide > Monitor > Connection log screen. See Monitor for more information on this screen. The Last failed issue column displays the reason for the last connection failure. |
Failed connection by SSID | This table displays the number of WiFi clients with WiFi connection/DHCP client/DNS failures in each WiFi network. The list displays the WiFi network with the most connection failures first, in descending order. Clicking the hyperlink in the # Failed connections column will direct you to the Site-wide > Monitor > Connection log screen. See Monitor for more information on this screen. |
Captive portal login issues by client | This table displays the list of WiFi clients with the corresponding number of failed hotspot authentication. The list displays the WiFi client that failed hotspot authentication the most number of times first, in descending order. Clicking the hyperlink in the Client device column will direct you to the Site-wide > Monitor > Client: Client device screen. See Clients for more information on this screen. Clicking the hyperlink in the # Failed authentication column will direct you to the Site-wide > Monitor > Connection log screen. See Monitor for more information on this screen. |
Failed connection by AP | This table displays the number of WiFi clients with WiFi connection/DHCP client/DNS failures in each access point. The list displays the access point with the most connection failures first, in descending order. Clicking the hyperlink in the # Failed connection column will direct you to the Site-wide > Monitor > Connection log screen. See Monitor for more information on this screen. |