Monitor
Use the Monitor menus to check the site features logs and containment list of the Nebula Devices for the selected site. Please click the following links to go to the respective Nebula Devices Monitor menus.
• Access points (Section 5.2 on page 235)
• Switches (Section 6.2 on page 276)
• Security router (Section 7.2 on page 316)
• Mobile router (Section 10.4 on page 479)
• Firewall (Section 8.2 on page 342)
• Security gateway (Section 9.2 on page 414)
Containment List
This screen shows a list of clients that are currently blocked in the site by the CDR security service. You can use this screen to release blocked clients. Click Site-wide > Monitor > Containment list to access this screen.
Site-wide > Monitor > Containment list
The following table describes the labels in this screen.
Label | Description |
|---|---|
Search | Enter a MAC or IP address to filter the list of clients. |
Time | This field displays the date and time CDR contained this client. |
IP address | This field displays the IPv4 address of the client contained by CDR. |
MAC address | This field displays the MAC address of the client contained by CDR. |
User | This field displays the user name of a client contained by CDR who has been authenticated for Internet access. The field is blank if user authentication is not required. |
Event type | This field displays details on the category of signature that triggered CDR: Web Filtering, Anti-Malware or IPS (IDP). |
Containment | This field displays if the client is blocked, quarantined or just triggers an alert. |
Time Remaining (mins.) | This field displays the amount of time left until this client is released by CDR. |
Connect to | This field displays the description of the Access Point or the interface of the Nebula Device that the contained client is connected to. |
Release/Add to Exempt List | |
Release | Select a client and then click this to release this client device from CDR containment. |
Add to Exempt List | Select a client, select an IPv4 address or MAC address, and then click OK to release this client device from CDR containment. This client device’s IP or MAC address is exempt from future CDR checking. |
Site Features Logs
This screen displays events from the Security Appliance within the selected site, such as CDR service events, alerts, and firmware management.
Click Site-wide > Monitor > Site features logs to access this screen.
Site-wide > Monitor > Site features logs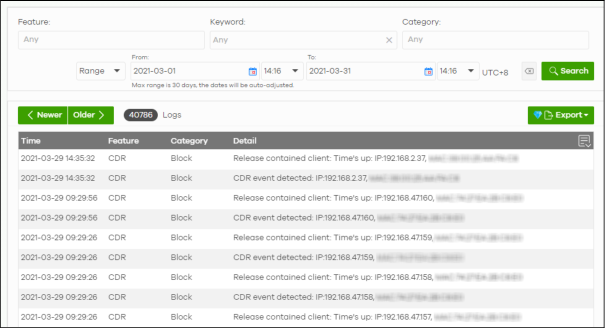
The following table describes the labels in this screen.
Label | Description |
|---|---|
Feature | Select the features that you want to view logs for. |
Keyword | Enter a keyword to filter the list of log entries. |
Category | Select the type of log messages you want to view. The available categories will depend on the features you have selected under Feature. |
Range/Before | Select filtering options, set a date, and then click Search to filter log entries by date. Range: Display log entries from the first specified date to the second specified date. Before: Display log entries from the beginning of the log to the selected date. |
Reset filters | Click this to return the search criteria to the previously saved time setting. |
Search | Click this to update the list of logs based on the search criteria. |
Newer/Older | Click to sort the log messages by most recent or oldest. |
N Logs | This shows the number of log messages (N) in the list. |
Export | Click this button to download the log list as a CSV or XML file to your computer. |
Time | This shows the date and time when the log was recorded. It uses the local time set for the site at Site-wide > Configure > Site settings. |
Feature | Select the feature that created the log message. |
Category | This shows the type of log message, for example “Block”. The available categories will depend on the feature. |
Detail | This shows the details of the event. |
Click this icon to display a greater or lesser number of configuration fields. |