Clients
This screen shows a list of all wired and WiFi clients connected to Nebula Devices (access points, Switches, Security Appliances) in the site. You can also block or allow clients. Click Site-wide > Clients to access this screen.
Site-wide > Clients > Client list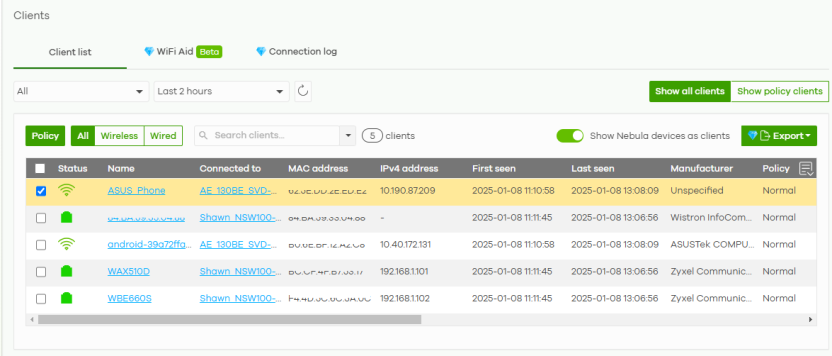
The following table describes the labels in this screen.
Label | Description |
|---|---|
Client list | Select to filter the Clients by device type (Access point clients, Switch clients, Firewall clients, Security gateway clients, Security router clients) the client is connected to. You can also set a time; the list shows each client’s connection status in the Last 2 hours, Last 24 hours, Last 7 days, Last 30 days, or Custom range. The maximum Custom range is 30 days within the past 365 days. When you select Clients: All, you can show each client’s connection status in the Last 2 hours and Last 24 hours only. |
 | Click this button to reload the data-related frames on this page. |
Show all clients | Click this to show all clients that have been online during the selected time period. |
Show policy clients | Click this to show clients that have a white-listed, blocked, or reserved IP policy applied to them, regardless of when they were last online. The client’s usage data is calculated according to the selected time period. |
Policy | Select the clients from the table below, and then choose the security policy that you want to apply to the selected clients. Choose one of the following policies, then click Apply policy. • Allow list: The selected clients to bypass captive portal authentication. Selecting the Allow list policy will automatically add the Reserve IP policy to the security firewall clients. • Block list: The selected clients cannot connect to the site. How a client is blocked depends on the connected Nebula Device type selected under Client list. AP: The client is blocked by MAC address from connecting to any AP in the site. Switch: The client is blocked by MAC address from sending or receiving network traffic. Gateway: The Security Appliance will not route traffic for the client’s IP address. Selecting the Block list policy will automatically add the Reserve IP policy to the security firewall clients. • To specific SSID: Selectively apply captive portal authentication to specific SSIDs on an AP. • Normal: The selected clients have no policies applied to them. • Reserve IP: The client is allowed by IPv4 address to connect to the site. This is the default policy. Select this to reserve/freeze the assigned dynamic IPv4 address to the client device. The security router client will be added to the Static DHCP table in the Site-wide > Configure > Security router > Interface > LAN interface configuration. The security firewall client will be added to the Static DHCP table in the Site-wide > Configure > Firewall > Interface > LAN interface configuration. |
All / Wireless / Wired | Select the type of clients that have been online during the selected time period. • All: Click this to show all clients that have been online during the selected time period. • Wireless: Click this to show all WiFi clients that have been online during the selected time period. • Wired: Click this to show all wired clients that have been online during the selected time period. |
Search clients | Specify your desired filter criteria to filter the list of clients (Status, Manufacturer, Connected to, Band (for All, Access point clients, and Security router clients), VLAN, Policy). |
N clients | This shows the number of clients (N) connected to the gateway in the site network. |
Show Nebula devices as clients | This allows you to show or hide the client Nebula Device(s) in the Client list table (for All clients only). By default, this switch is ON for the sites created before the NCC 18.00 release. Otherwise, this switch is OFF for the sites created after the NCC 18.00 release. |
Export | Click this button to save the client list as a CSV or XML file to your computer. |
General fields | |
Select an entry’s checkbox to select a specific client. Otherwise, select the checkbox in the table heading row to select all clients. | |
Status | This shows whether the client is online (green) or offline (red), and whether the client is wired or wireless. • Clients connected to an Access Point are reported as wireless. • Clients connected to a Switch or Security Appliance are reported as wired. |
Name | This shows the descriptive name of the client. By default, this is the client’s MAC address. The client description can be obtained through the following: • User customized description • Hostname detected from client’s LLDP (Link Layer Discovery Protocol) System Name • Hostname detected from the Nebula-managed access point • Hostname detected from the Nebula-managed Security Appliance. Click the name to display the individual client statistics. See wireless: WiFi Client Details and wired: Wired Client Details. |
Connected to | This shows the name of the Nebula Device to which the client is connected in this site. Click the Nebula Device name to display the screen where you can view detailed information about the Nebula Device. |
MAC address | This shows the MAC address of the non-WiFi7 client or the MLD MAC address of the WiFi7 client. Click the MAC address to display the individual client statistics. See wireless: WiFi Client Details and wired: Wired Client Details. |
IPv4 address | This shows the IPv4 address of the client. By default, the field is blank. The client IPv4 address can be obtained through the following: • IPv4 address detected from client’s LLDP (Link Layer Discovery Protocol) Management Address • IPv4 address detected from the Nebula-managed access point • IPv4 address detected from the Nebula-managed Security Appliance. |
First seen | This shows the first date and time the client was discovered over the specified period of time. |
Last seen | This shows the last date and time the client was discovered over the specified period of time. |
Manufacturer | This shows the manufacturer of the client hardware. |
Policy | This shows the security policy applied to the client. |
Note | This shows additional information about the client. |
User | This shows the name or the email address used to authenticate the wireless/wired clients. |
Band | This shows whether the SSID use either 2.4 GHz band, 5 GHz band, or the 6 GHz band. |
Capability | This shows the WiFi standards supported by the client or the supported standards currently being used by the client. |
SSID name | This shows the name of the Access Point and Security Router’s WiFi network to which the client is connected. |
Security | This shows the encryption method used to connect to the Access Point or Security Router. |
Association time | This shows the time the client first associated with the Nebula Device’s WiFi network. |
Authentication | This shows the authentication method used for this client. |
Channel | This shows the channel number currently used by the WiFi interface. |
Signal strength | This shows the RSSI (Received Signal Strength Indicator) of the client’s WiFi connection, and an icon showing the signal strength. Icon default thresholds: • Green/5 blocks: signal is greater than –67 dBm, strong signal • Amber/4 blocks: signal –67 to –73 dBm, average signal • Amber/3 blocks: signal –74 to –80 dBm, below average signal • Red/2 blocks: signal is less than –80 dBm, weak signal |
Port | This shows the port number of the Nebula Device the client is connected. |
LLDP | This shows the LLDP (Link Layer Discovery Protocol) information received from the remote device. |
VLAN | This shows the ID number of the VLAN to which the client belongs. |
OS | This shows the operating system running on the client device, if known. |
Rx rate | This shows the maximum transmission rate of the client. |
Download | This shows the amount of data received by the Nebula Device’s clients. |
Upload | This shows the amount of data transmitted by the Nebula Device’s clients. |
Usage | This shows the amount of data consumed by the Nebula Device’s clients. |
Tx rate | This shows the maximum reception rate of the client. |
 | Click this icon to display a greater or lesser number of information about a specific client. |
WiFi Client Details
Click a WiFi client entry in the Site-wide > Clients > Clients list screen to display individual client statistics.
Site-wide > Clients > Clients list: WiFi Client Details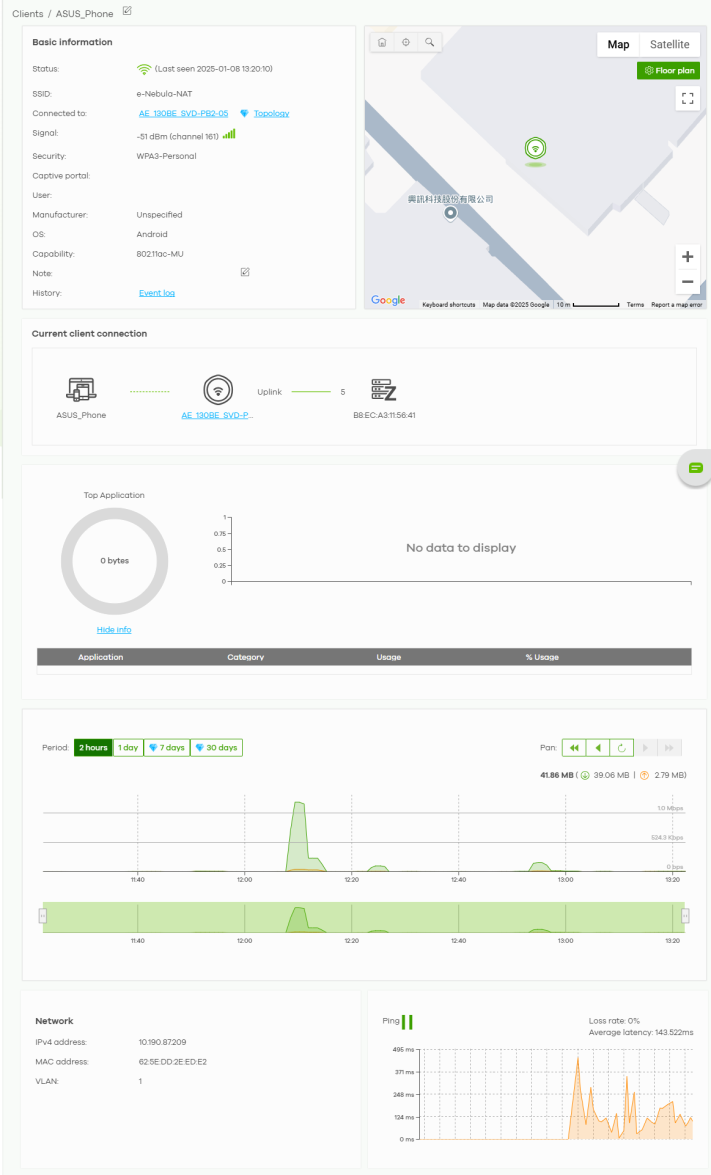
The following table describes the labels in this screen.
Label | Description |
|---|---|
Clients | Click the edit icon to change the client name. |
Basic information | |
Status | This shows whether the client is online (green), or goes offline (red). It also shows the last date and time the client was discovered. |
SSID | This shows the name of the Access Point’s WiFi network to which the client is connected. |
Connected to | This shows the name of the Nebula managed Access Point to which the client is connected. Click the name to display the individual Access Point statistics. See Access Point Details. |
Signal | This shows the RSSI (Received Signal Strength Indicator) of the client’s WiFi connection, and an icon showing the signal strength. Icon default thresholds: • Green/5 blocks: signal is greater than –67 dBm, strong signal • Amber/4 blocks: signal –67 to –73 dBm, average signal • Amber/3 blocks: signal –74 to –80 dBm, below average signal • Red/2 blocks: signal is less than –80 dBm, weak signal |
Security | This shows the encryption method used to connect to the Access Point. |
Captive portal | This shows the web authentication method used by the client to access the network. |
User | This shows the number of users currently connected to the network through the client device. |
Manufacturer | This shows the manufacturer of the device connected to the Access Point. |
OS | This shows the operating system running on the client device, if known. |
Capability | This shows the WiFi standards supported by the client or the supported standards currently being used by the client. |
Note | This shows additional information for the client. Click the edit icon to change it. |
History | Click Event log to go to the Site-wide > Monitor > Access points > Event log screen. |
Map | This shows the location of the client on the Google map. |
Current client connection | This shows the Nebula Device(s) currently connecting to the client. |
Top Application | Click Show info to view the following fields. Alternatively, click Hide info to hide the following fields. |
# | This shows the ranking of the application. |
Application | This shows the application name. |
Category | This shows the category of the application, for example email, file sharing. |
Usage | This shows the amount of data consumed by the application. |
% Usage | This shows the percentage of usage for the application. |
Period | Select to view the statistics in the past two hours, day, week or month. |
Pan | Click to move backward or forward by two hours or one day. |
y-axis | The y-axis shows the transmission speed of data sent or received by the client in kilobits per second (Kbps). |
x-axis | The x-axis shows the time period over which the traffic flow occurred. |
Network | |
IPv4 address | This shows the IP address of the client. |
MAC address | This shows the MAC address of the client. |
VLAN | This shows the ID number of the VLAN to which the client belongs. |
Ping | Click the button to ping the client’s IP address from the Nebula AP to test connectivity. |
Loss rate | This shows the rate of packet loss when you perform ping. |
Average latency | This shows the average latency in ms when you perform ping. |
Wired Client Details
Click a wired client’s descriptive name in the Site-wide > Clients > Clients list screen to display individual client statistics.
Site-wide > Clients > Clients list: Wired Client Details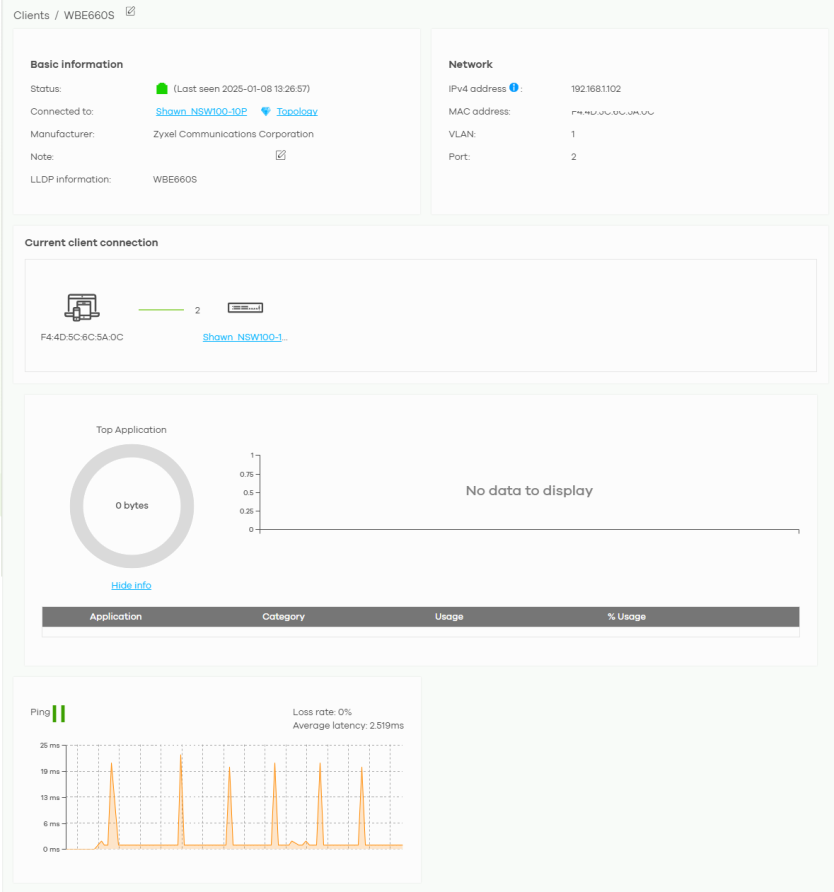
The following table describes the labels in this screen.
Label | Description |
|---|---|
Clients | Click the edit icon to change the client name. |
Basic information | |
Status | This shows whether the client is online (green) or offline (red). It also shows the last date and time the client was discovered, and whether the client is wired or wireless. |
Connected to | This shows the name of the Security Appliance to which the client is connected. Click the Nebula Device name to display the screen where you can view detailed information about the Nebula Device. |
User | This shows the number of users currently connected to the network through the client device. |
Manufacturer | This shows the manufacturer of the client device. |
OS | This shows the operating system running on the client device, if known. |
Note | Enter information about this Nebula Device, for yourself or for other administrators. |
History | Click Event log to go to the Site-wide > Monitor > Access points > Event log screen. |
LLDP information | This shows the LLDP (Link Layer Discovery Protocol) information received from the remote device. |
Network | |
IPv4 address | This shows the IPv4 address of the client. |
MAC address | This shows the MAC address of the client. |
VLAN | This shows the VLAN ID for this client. |
Interface | This shows the interface of the Nebula Device to which the client is connected. |
Port | This shows the port number of the Nebula Device the client is connected. |
Port forwarding | This shows the port forwarding rule configured for inbound traffic. Otherwise, it is none. |
1:1 NAT IPs | This shows the local (LAN) IP address of the Nebula Device the client is connected. |
Current client connection | This shows the Nebula Device(s) currently connecting to the client. |
Top Application | Click Show info to view the following fields. Alternatively, click Hide info to hide the following fields. |
# | This shows the ranking of the application. |
Application | This shows the application name. |
Category | This shows the category of the application, for example email, file sharing. |
Usage | This shows the amount of data consumed by the application. |
% Usage | This shows the percentage of usage for the application. |
Move the cursor over the chart to see the transmission rate at a specific time. | |
Zoom | Select to view the statistics in the past 2 hours, day, week, or month. |
Pan | Click to move backward or forward by one day or week. |
Ping | Click the button to ping the client’s IP address from the gateway to test connectivity. |
Loss rate | This shows the rate of packet loss when you perform ping. |
Average latency | This shows the average latency in ms when you perform ping. |
WiFi Aid
The WiFi Aid screen displays the number of WiFi clients that cannot connect to a Nebula Device(s) in a site. It also displays the number of WiFi clients who cannot authenticate with a Nebula Device acting as a hotspot (captive portal) or who have timed out.
Use this screen to identify connection problems between WiFi clients and supported Nebula Device(s). Click Site-wide > Clients > WiFi Aid to access this screen.
Site-wide > Clients > WiFi Aid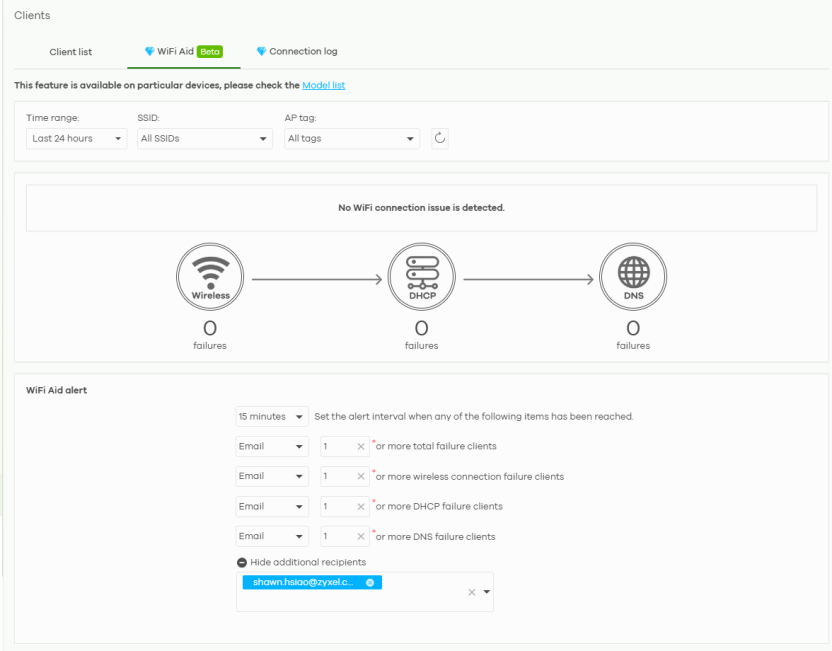
The following table describes the labels in this screen.
Label | Description |
|---|---|
WiFi Aid | Select a Time range. The overview will show all WiFi clients’ connection issues in the Last hour, Last 12 hours, Last 24 hours, or Custom range (from 15 minutes to one day). Select to filter the overview of the client’s WiFi connection issues based on one AP WiFi network (SSID), or all AP WiFi networks in this site (All SSIDs, default). Select to filter the overview of all WiFi clients’ connection issues based on one AP tag, or All tags (default). This is the tag you create in Site-wide > Devices > Access points. Click the Refresh icon to update this screen. |
Client devices affected by connection problems | This chart displays the number of WiFi clients in this site with the following connection problems. • Wireless (WiFi) failures. This displays the number of WiFi clients that could not connect to the Nebula Device. – Make sure the WiFi client is within transmission range of the Nebula Device. – Make sure the WiFi client connects to the correct SSID and enters the correct password. – Make sure the WiFi adapter on the WiFi client is working properly. • DHCP failures. This displays the number of WiFi clients that failed to receive an IP address due to DHCP failure/timeout with the DHCP server. – Increase the number of IP addresses that the DHCP server can allocate. – Shorten the DHCP lease time that the WiFi client can use the assigned IP address. • DNS failures. This displays the number of WiFi clients that failed DNS query due to DNS timeout from a DNS server. – Make sure the DNS server is working properly. If the Nebula Device is acting as the DHCP server or DNS server in this site, check the settings. For a Security Router, see LAN Interface Configuration for more information. For a Security Firewall, see Internal Interface Configuration for more information. For a Security Gateway, see Local LAN (Add VLAN) for more information. For a Mobile Router, see Live Tools for more information. |
Client devices affected by captive portal problems | This chart displays the number of WiFi clients that could not connect to the Nebula Device acting as a hotspot. This includes entering the wrong user credentials or an authentication timeout. |
Failed clients | This table displays the number of WiFi clients with failed connection attempts (WiFi connection/DHCP failures/DNS failures) and the number of total connection attempts. The list displays the WiFi client with the most connection failures first, in descending order. Clicking the hyperlink in the Client device column will direct you to the Site-wide > Monitor > Client: Client device screen. See Clients for more information on this screen. Clicking the numerator hyperlink in the # Failed/total connections column will direct you to the Site-wide > Monitor > Connection log screen. See Monitor for more information on this screen. The Last failed issue column displays the reason for the last connection failure. |
Failed connection by SSID | This table displays the number of WiFi clients with WiFi connection/DHCP failures/DNS failures in each WiFi network. The list displays the WiFi network with the most connection failures first, in descending order. Clicking the hyperlink in the # Failed connections column will direct you to the Site-wide > Monitor > Connection log screen. See Monitor for more information on this screen. |
Captive portal login issues by client | This table displays the list of WiFi clients with the corresponding number of failed hotspot authentication or timeout. The list displays the WiFi client that could not connect to the Nebula Device acting as a hotspot the most number of times first, in descending order. Clicking the hyperlink in the Client device column will direct you to the Site-wide > Clients > Client: Client device screen. See Clients for more information on this screen. Clicking the hyperlink in the # Failed authentication column will direct you to the Site-wide > Monitor > Connection log screen. See Monitor for more information on this screen. |
Failed connection by AP | This table displays the number of WiFi clients with WiFi connection/DHCP failures/DNS failures to each Nebula Device. The list displays the Nebula Device with the most connection failures first, in descending order. Clicking the hyperlink in the # Failed connection column will direct you to the Site-wide > Clients > Connection log screen. See Monitor for more information on this screen. |
WiFi Aid alert | Specify how long (15/30 minutes / 1 hour) the NCC waits before generating and sending an alert. Select the items to have the NCC generate and send an alert by email when the following events has reached the threshold (maximum 999): • WiFi clients with failed connection attempts (WiFi connection / DHCP failures / DNS failures). • WiFi clients with failed WiFi connection attempts. • WiFi clients with DHCP failures. • WiFi clients with DNS failures. |